Payroll Register
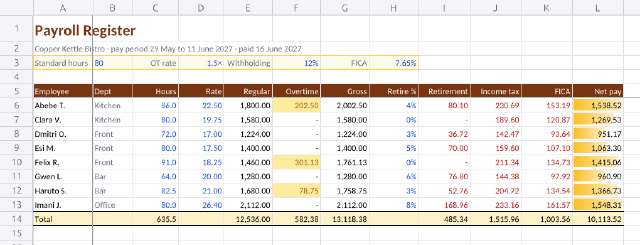
A fortnight's payroll for a small bistro, from hours and rates through overtime, pre-tax retirement, withholding and FICA to net pay.
1 sheet; used range A1:L14
Kit 11 / 16 · 41 samples · 7 categories
Spreadsheets: formulas, number formats, styles, merged cells, tables, charts and several sheets. Saved as .xlsx.
saved → cafe-chain-quarterly-rollup.xlsx ✓96 commands · 145 ms
sheet.rename(name)range.setValues(range, values)home.fontSize(range, size)home.bold(range, on)home.fontColor(range, color)home.fontColor(range, color)A fortnight's payroll for a small bistro, from hours and rates through overtime, pre-tax retirement, withholding and FICA to net pay.
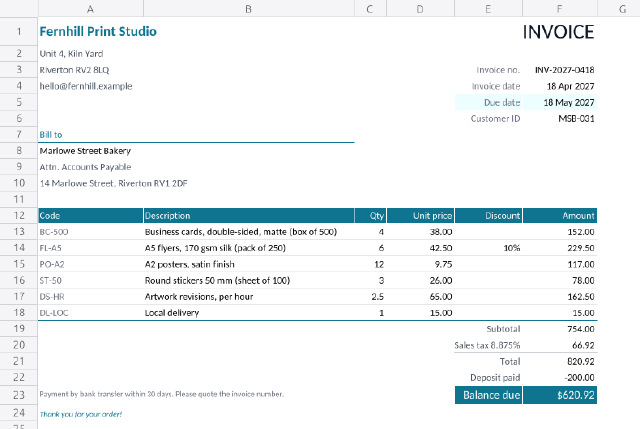
A ready-to-send invoice with line discounts, rounded sales tax, a deposit and the balance due, laid out without gridlines.
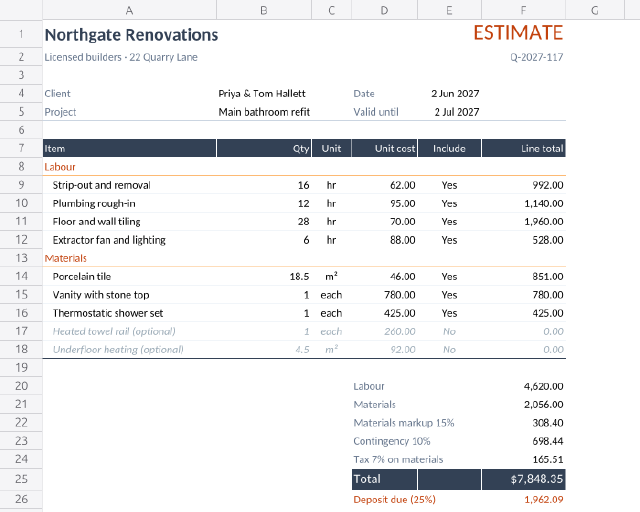
A contractor's bathroom quote with labour and materials, optional extras switched by a Yes/No list, markup, contingency, tax and deposit.
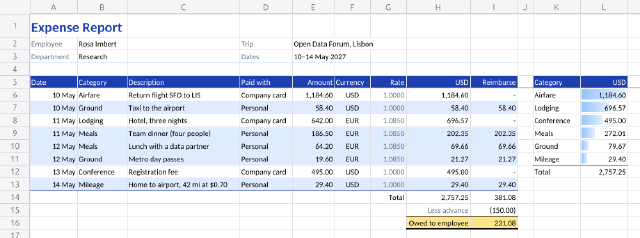
A conference trip's receipts in two currencies, converted, split into company-paid and reimbursable, and summed by category.
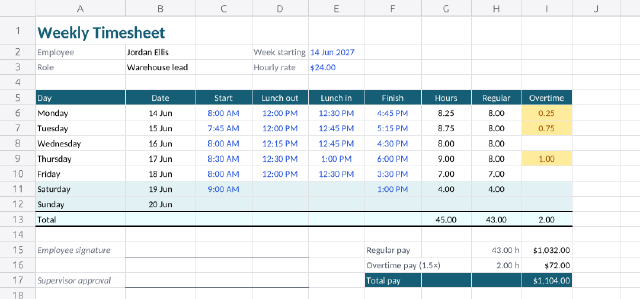
Clock-in and clock-out times turned into daily hours, daily overtime past eight hours and the week's pay, with time arithmetic.
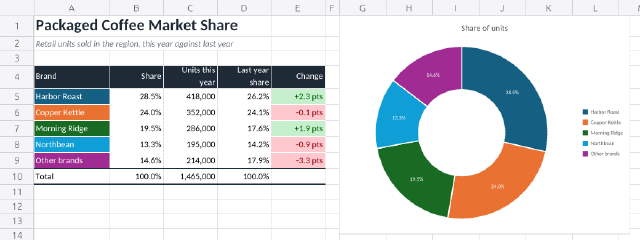
Unit sales of five coffee brands turned into shares, a change-in-points column and a labelled doughnut chart.
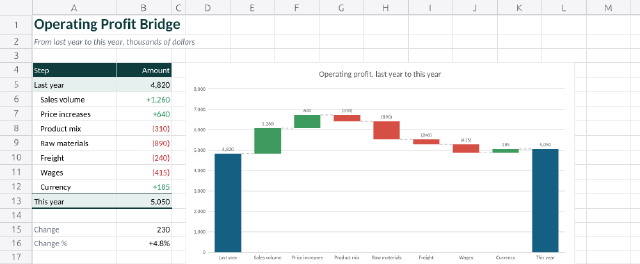
A waterfall chart that walks operating profit from last year to this year through its drivers.
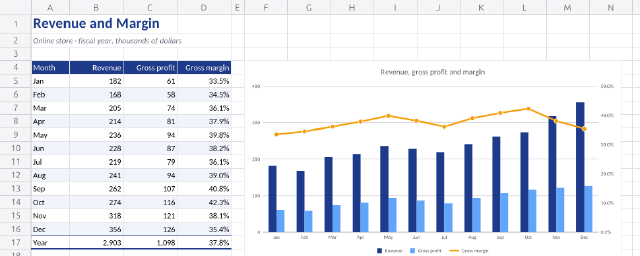
Monthly revenue and gross profit as columns with gross margin as a line on a secondary axis.
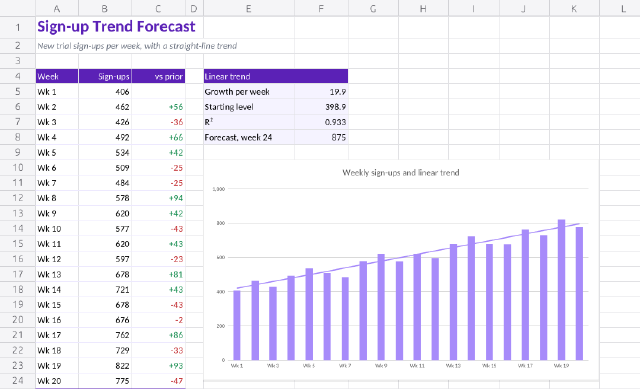
Twenty weeks of trial sign-ups as columns with a linear trendline, the fit worked out in cells and a week-24 forecast.
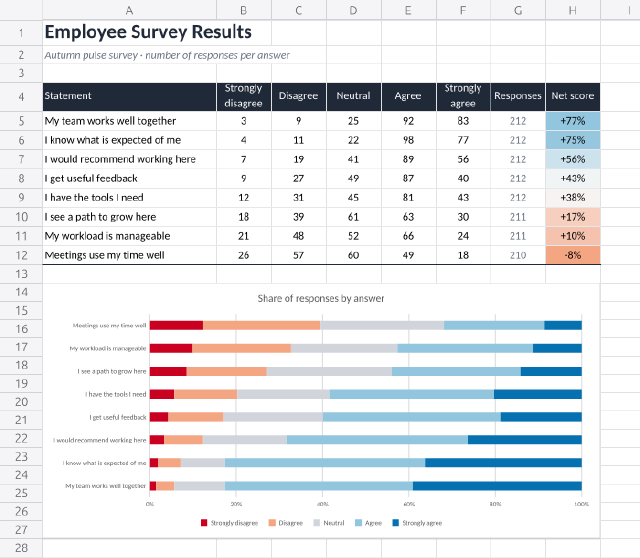
Five-point agreement answers for eight survey statements, shown as a 100% stacked bar chart with a net-agreement score.
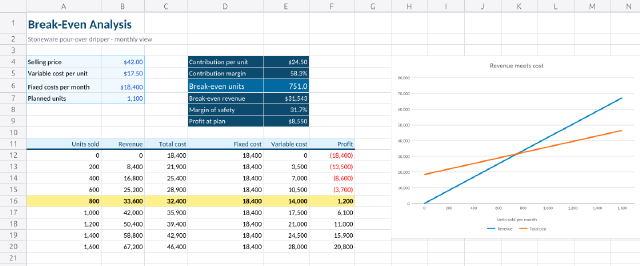
How many coffee drippers a small pottery has to sell each month to cover its costs, with the revenue and cost lines crossing on a chart.
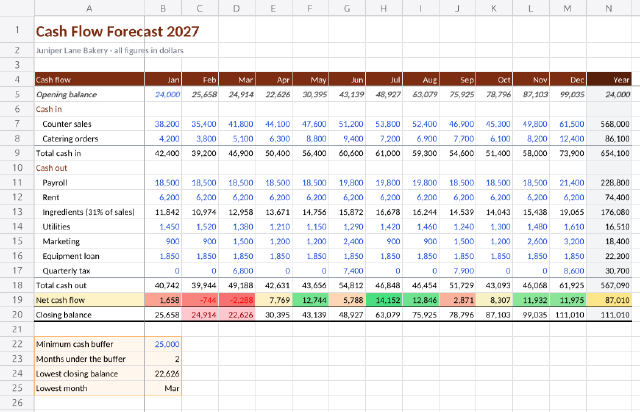
A bakery's year of cash in and cash out, month by month, with running balances, a colour scale and a warning when cash dips under the buffer.
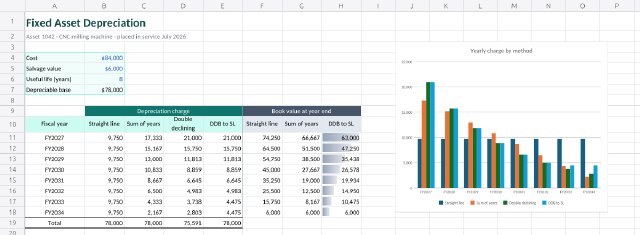
One machine depreciated four ways, with SLN, SYD, DDB and VDB side by side and the book value each leaves behind.
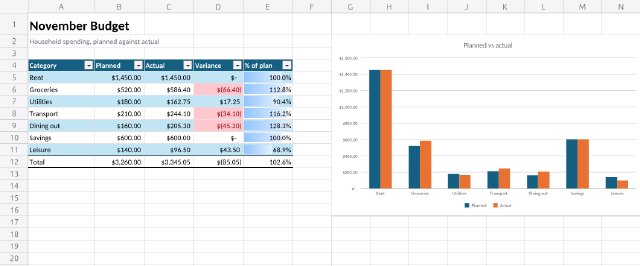
A monthly budget with planned and actual spending, variance formulas, a total row and a column chart.
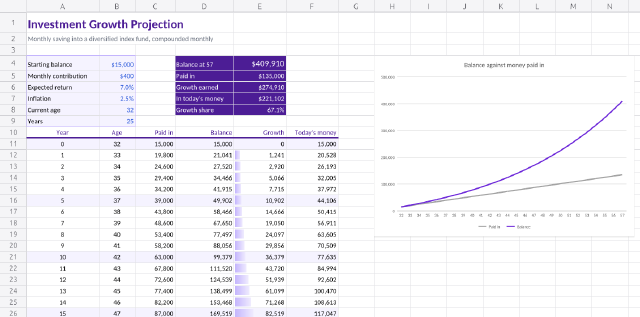
Twenty-five years of monthly saving projected with FV, split into money paid in and growth earned, with a line chart of the gap opening up.
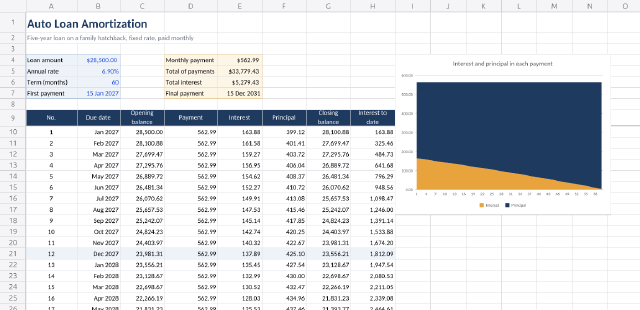
A five-year car loan paid off month by month, with PMT, IPMT and PPMT splitting every payment into interest and principal.
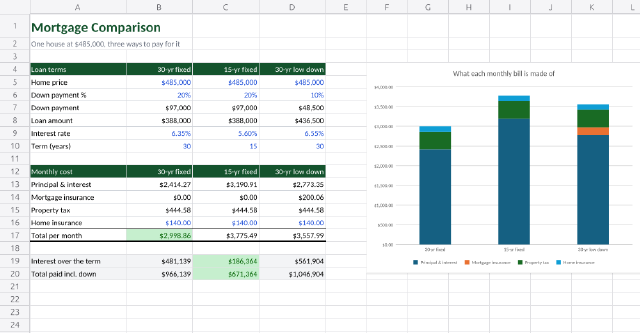
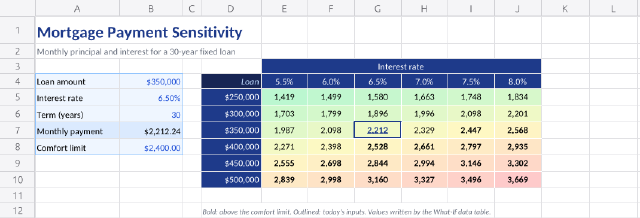
Three ways to finance the same house side by side, from the monthly bill to the interest paid over the life of the loan.
A two-variable data table of monthly payments for every loan size and interest rate, shaded from affordable to stretched.
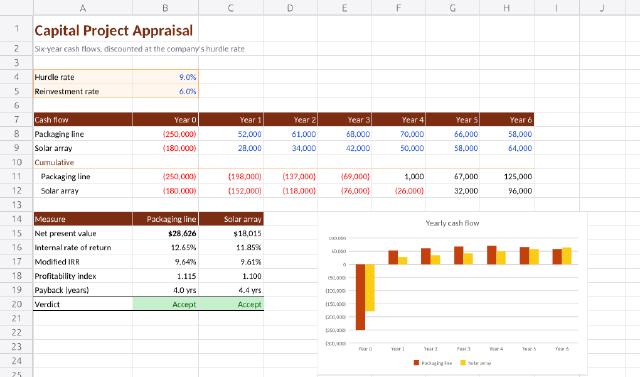
Two capital projects compared on NPV, IRR, MIRR, profitability index and payback, with a verdict for each.
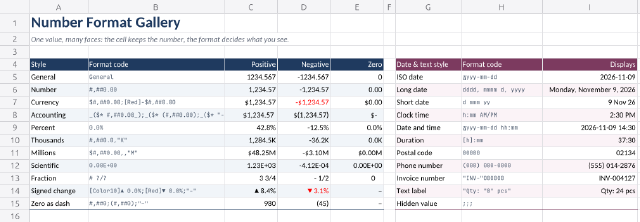
A reference card that shows the same numbers, dates and codes through a dozen built-in and custom number formats.
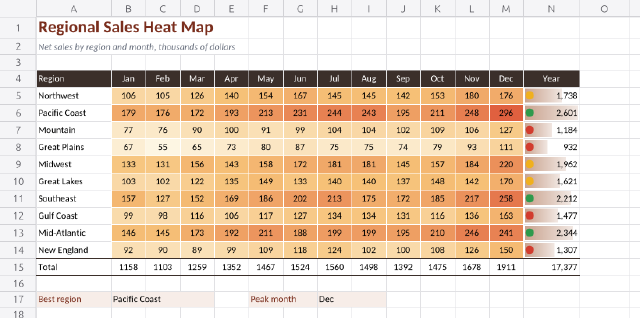
Twelve months of sales for ten regions, shaded by a three-colour scale so the peaks and the quiet months stand out.
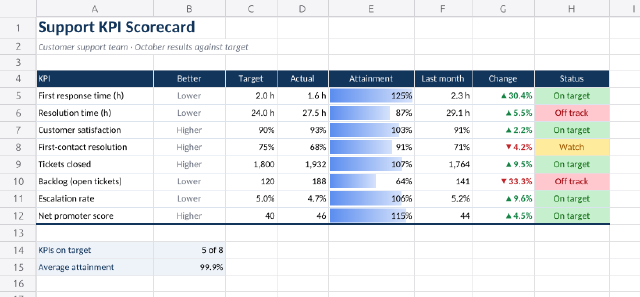
A monthly customer-support scorecard with attainment data bars, coloured trend arrows and rule-driven status pills.
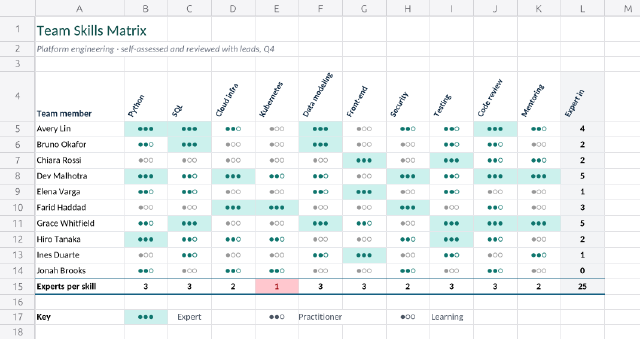
An engineering team's skills grid with angled column headers, dot ratings from a number format and named cell styles.
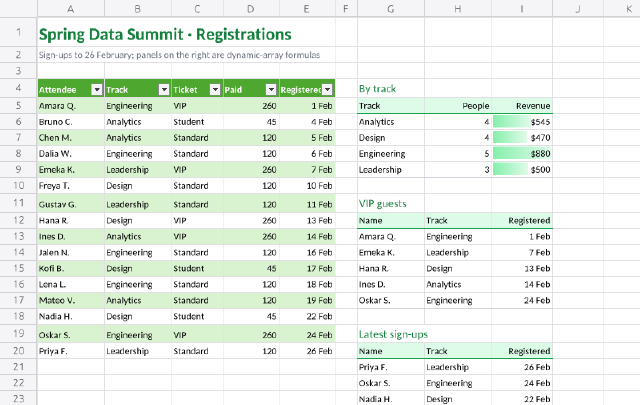
Three spilling summaries of a conference sign-up list, built with UNIQUE, SORT, FILTER, SORTBY, CHOOSECOLS and TAKE.
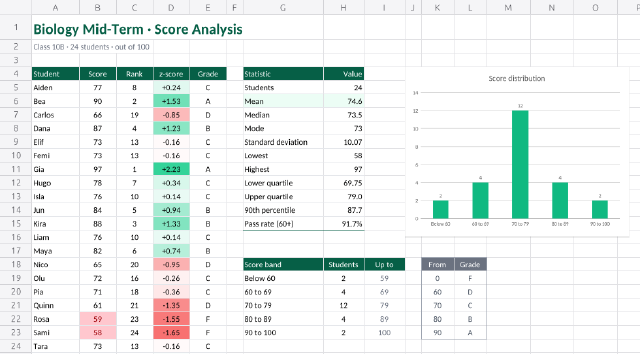
A class's test scores described with AVERAGE, MEDIAN, MODE, STDEV, QUARTILE and PERCENTILE, binned with FREQUENCY into a histogram.
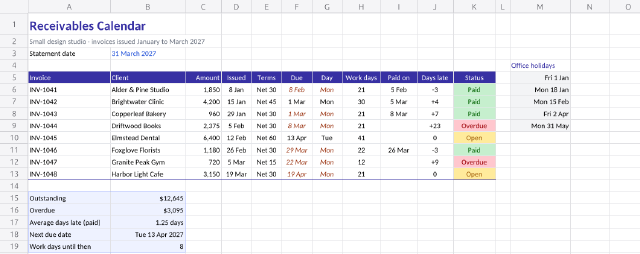
Due dates that skip weekends and office holidays with WORKDAY, business days with NETWORKDAYS, and a status for every invoice.
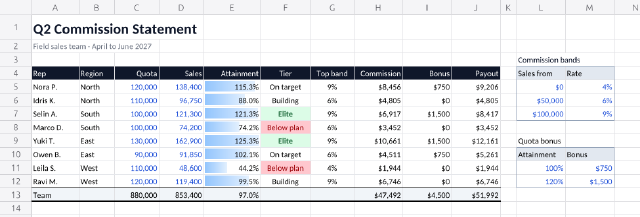
Quarterly payouts for eight reps with tiered marginal commission from a named LAMBDA, VLOOKUP rate bands and IFS bonuses.
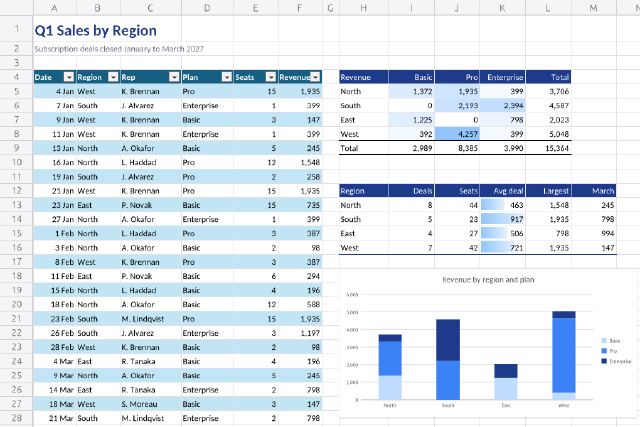
A quarter's deal log rolled up by region and product with SUMIFS, COUNTIFS, AVERAGEIFS and MAXIFS.
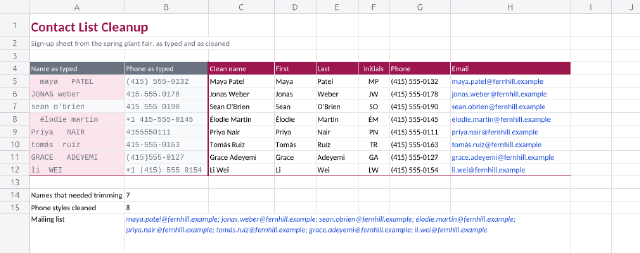
A messy contact import tidied with TRIM, PROPER, TEXTBEFORE, TEXTAFTER, TEXTJOIN and a LET formula that rebuilds every phone number.
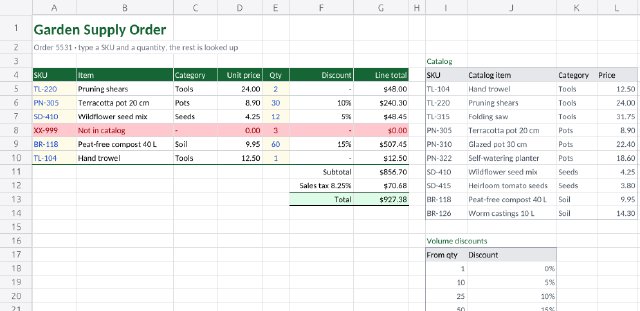
An order form that fills in item names, categories, prices and volume discounts from a catalog with XLOOKUP and INDEX/MATCH.
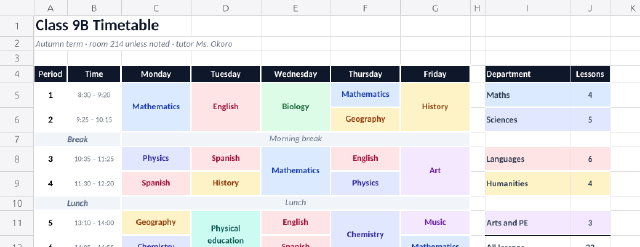
A secondary-school week with double lessons as merged cells, merged break rows and subject colours from text rules.
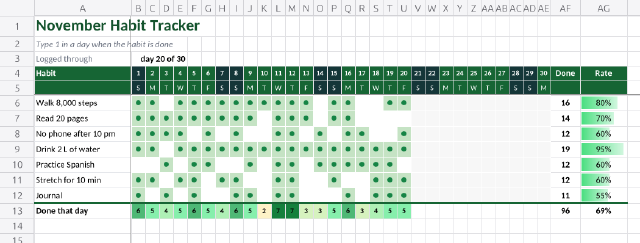
A November habit grid where a 1 becomes a dot through a number format, with completion rates, data bars and a daily heat row.
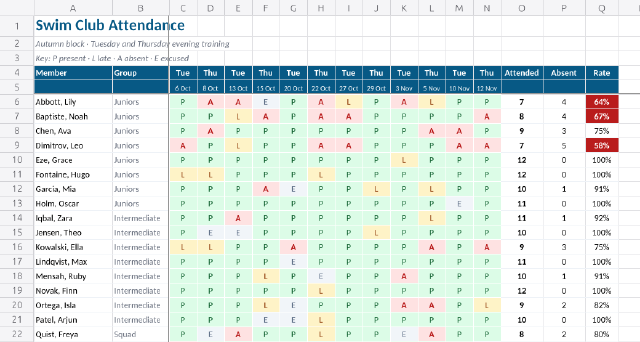
Twelve training sessions for 24 swimmers, with frozen names and dates, letter codes from a dropdown and colour-coded attendance rates.
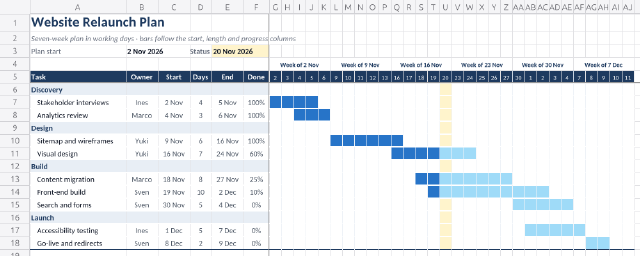
A seven-week project plan whose Gantt bars, progress fill and status-date column are all drawn by conditional formatting.
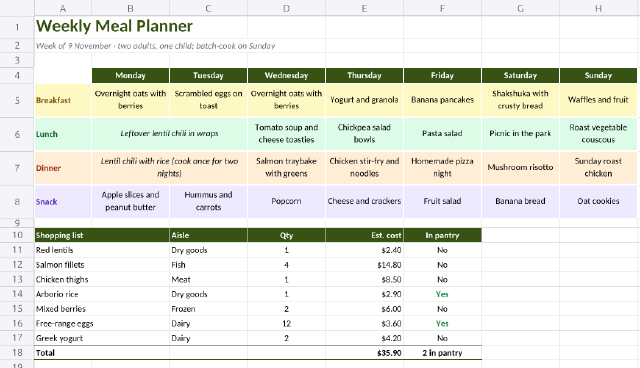
A seven-day meal grid with wrapped text, merged cells for batch-cooked meals and a costed shopping list.
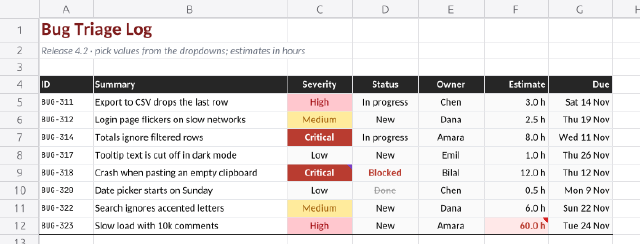
A triage sheet with dropdown lists for severity, status and owner, number and date rules, input messages and review notes.
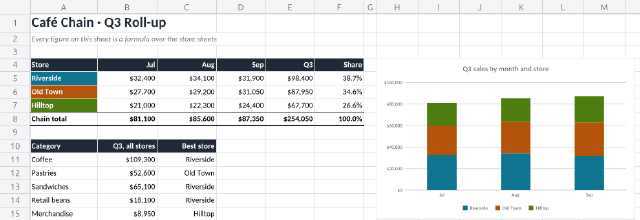
Three store sheets with coloured tabs feed a summary sheet through cross-sheet and 3-D references.
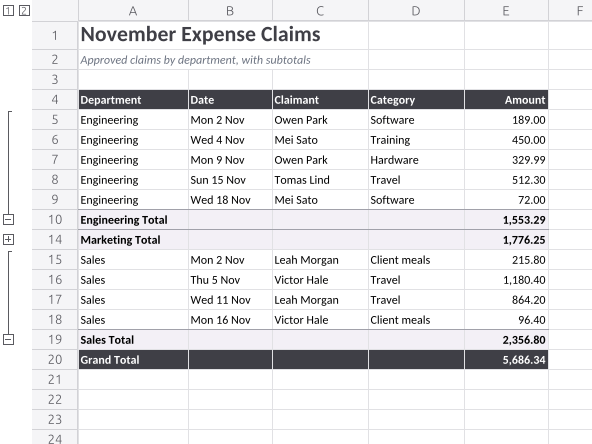
A month of expense claims sorted by department, with automatic subtotal rows, a grand total and an outline to collapse the detail.
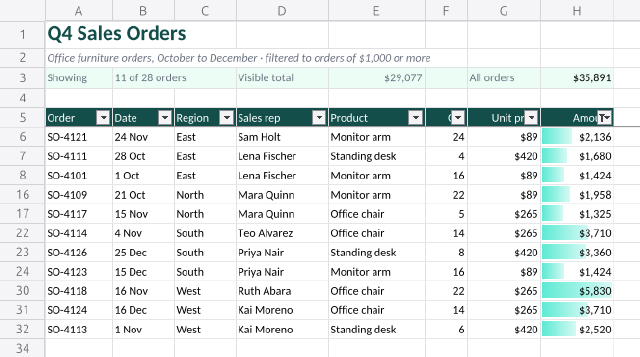
A quarter's order list sorted by region and amount, with an AutoFilter that keeps only orders of $1,000 or more.
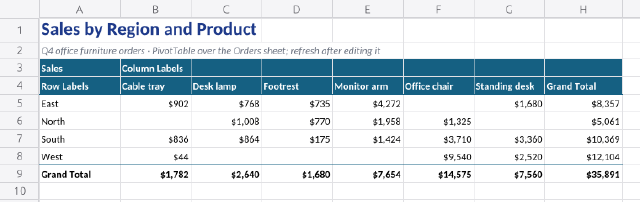
A PivotTable that turns a quarter's order list into sales by region and product, with grand totals.
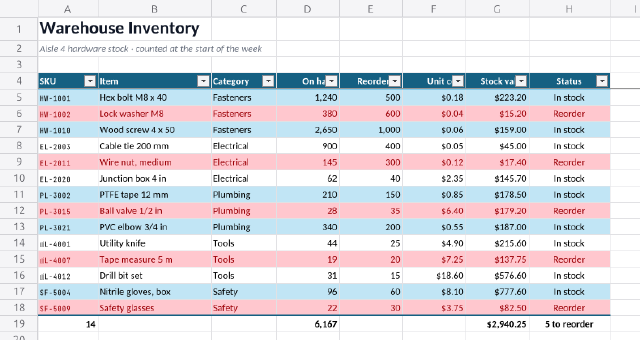
A stock list formatted as a structured table, with calculated columns, a total row and reorder alerts.