Sign-up Trend Forecast
Twenty weeks of trial sign-ups as columns with a linear trendline, the fit worked out in cells and a week-24 forecast.
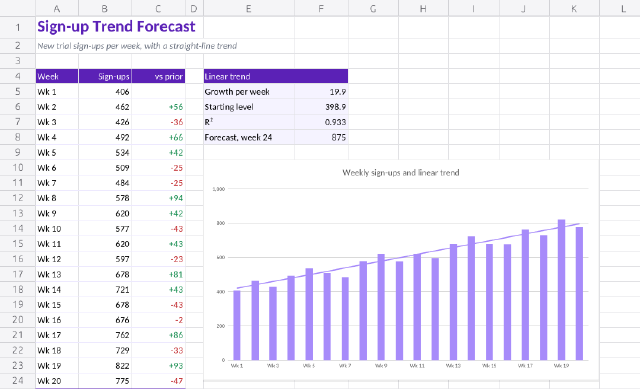
Weekly sign-ups wobble, but the trend is clear once a linear trendline runs through the columns. SLOPE, INTERCEPT and RSQ compute the same line in cells against the week numbers from SEQUENCE, and FORECAST.LINEAR projects week 24. The week-over-week column uses a signed format with green and red rules.
Steps
38 commandssteps:
- { command: range.setValues, params: { range: A1, values: [["Sign-up Trend Forecast"], ["New trial sign-ups per week, with a straight-line trend"]] } }
- command: range.setValues
params:
range: A4
values:
- [Week, Sign-ups, vs prior]
- ["Wk 1", 406, null]
- ["Wk 2", 462, "=B6-B5"]
- ["Wk 3", 426, "=B7-B6"]
- ["Wk 4", 492, "=B8-B7"]
- ["Wk 5", 534, "=B9-B8"]
- ["Wk 6", 509, "=B10-B9"]
- ["Wk 7", 484, "=B11-B10"]
- ["Wk 8", 578, "=B12-B11"]
- ["Wk 9", 620, "=B13-B12"]
- ["Wk 10", 577, "=B14-B13"]
- ["Wk 11", 620, "=B15-B14"]
- ["Wk 12", 597, "=B16-B15"]
- ["Wk 13", 678, "=B17-B16"]
- ["Wk 14", 721, "=B18-B17"]
- ["Wk 15", 678, "=B19-B18"]
- ["Wk 16", 676, "=B20-B19"]
- ["Wk 17", 762, "=B21-B20"]
- ["Wk 18", 729, "=B22-B21"]
- ["Wk 19", 822, "=B23-B22"]
- ["Wk 20", 775, "=B24-B23"]
- command: range.setValues
params:
range: E4
values:
- [Linear trend, null]
- [Growth per week, "=SLOPE(B5:B24,SEQUENCE(20))"]
- [Starting level, "=INTERCEPT(B5:B24,SEQUENCE(20))"]
- [R², "=RSQ(B5:B24,SEQUENCE(20))"]
- ["Forecast, week 24", "=FORECAST.LINEAR(24,B5:B24,SEQUENCE(20))"]
- { command: home.fontSize, params: { range: A1, size: 20 } }
- { command: home.bold, params: { range: A1 } }
- { command: home.fontColor, params: { range: A1, color: "#5b21b6" } }
- { command: home.italic, params: { range: A2 } }
- { command: home.fontColor, params: { range: A2, color: "#6b7280" } }
- { command: home.fillColor, params: { range: "A4:C4", color: "#5b21b6" } }
- { command: home.fontColor, params: { range: "A4:C4", color: "#ffffff" } }
- { command: home.bold, params: { range: "A4:C4" } }
- { command: home.alignRight, params: { range: "B4:C4" } }
- { command: home.numberFormat, params: { range: "B5:B24", format: "#,##0" } }
- { command: home.numberFormat, params: { range: "C5:C24", format: "+#,##0;-#,##0;0" } }
- { command: home.conditionalFormat, params: { range: "C6:C24", rule: { type: expression, formula: "=C6>0", style: { font: { color: { Rgb: 1477711 } } } } } }
- { command: home.conditionalFormat, params: { range: "C6:C24", rule: { type: expression, formula: "=C6<0", style: { font: { color: { Rgb: 12592682 } } } } } }
- { command: home.borders, params: { range: "A5:C24", preset: insideHorizontal, color: "#ede9fe" } }
- { command: home.borders, params: { range: "A24:C24", preset: bottom, color: "#5b21b6" } }
- { command: home.mergeAcross, params: { range: "E4:F4" } }
- { command: home.fillColor, params: { range: "E4:F4", color: "#5b21b6" } }
- { command: home.fontColor, params: { range: "E4:F4", color: "#ffffff" } }
- { command: home.bold, params: { range: "E4:F4" } }
- { command: home.fillColor, params: { range: "E5:F8", color: "#f5f3ff" } }
- { command: home.numberFormat, params: { range: "F5:F6", format: "0.0" } }
- { command: home.numberFormat, params: { range: "F7", format: "0.000" } }
- { command: home.numberFormat, params: { range: "F8", format: "#,##0" } }
- { command: home.bold, params: { range: "F5:F8" } }
- { command: home.columnWidth, params: { cols: "A:A", width: 56 } }
- { command: home.columnWidth, params: { cols: "B:C", width: 70 } }
- { command: home.columnWidth, params: { cols: "D:D", width: 24 } }
- { command: home.columnWidth, params: { cols: "E:E", width: 120 } }
- { command: home.columnWidth, params: { cols: "F:F", width: 70 } }
- { command: home.columnWidth, params: { cols: "G:K", width: 66 } }
- { command: home.rowHeight, params: { rows: "1:1", height: 28 } }
- { command: insert.chart, params: { range: "A4:B24", type: column, at: E10, width: 520, height: 290 }, as: chart }
- command: drawing.chart
params:
id: "1"
title: Weekly sign-ups and linear trend
legend: null
yAxis: { min: 0, max: 1000, major: 200 }
seriesFormat:
- { index: 0, color: "#a78bfa", trendline: linear }
- { command: drawing.describe, params: {}, as: drawing }
- { command: sheet.read, params: { range: "F5:F8" }, as: fit }Checks
9 checks on every buildresults.drawing.objects.0.chart.kind= "column"results.drawing.objects.0.chart.categories= {"count":20}results.drawing.objects.0.chart.series.0.trendline= {"kind":"linear"}results.fit.values.0.0= {"approx":19.851128,"tol":0.0001}results.fit.values.1.0= {"approx":398.863158,"tol":0.0001}results.fit.values.2.0= {"approx":0.933083,"tol":0.00001}results.fit.values.3.0= {"approx":875.290226,"tol":0.001}- Diagnostics: none, the kit's own check finds nothing wrong
- The saved document opens again, and its thumbnail matches
thumb.pngwithin the render tolerance
Related
More Sheet samples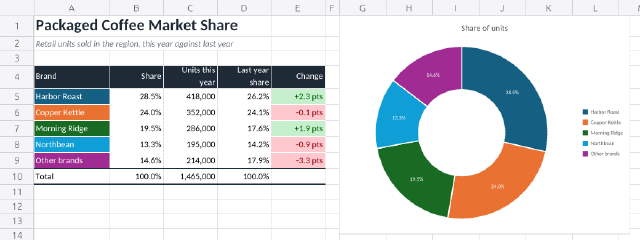
Market Share Doughnut
Unit sales of five coffee brands turned into shares, a change-in-points column and a labelled doughnut chart.
Profit Bridge Waterfall
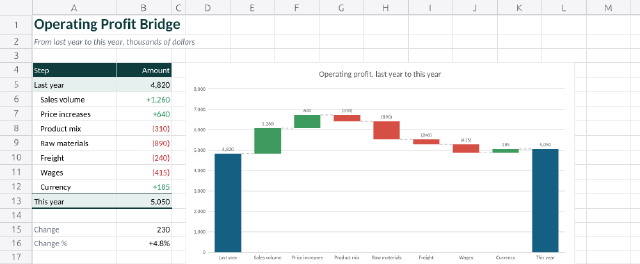
A waterfall chart that walks operating profit from last year to this year through its drivers.
Revenue and Margin Combo
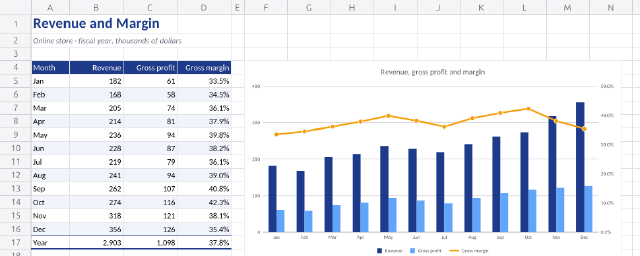
Monthly revenue and gross profit as columns with gross margin as a line on a secondary axis.
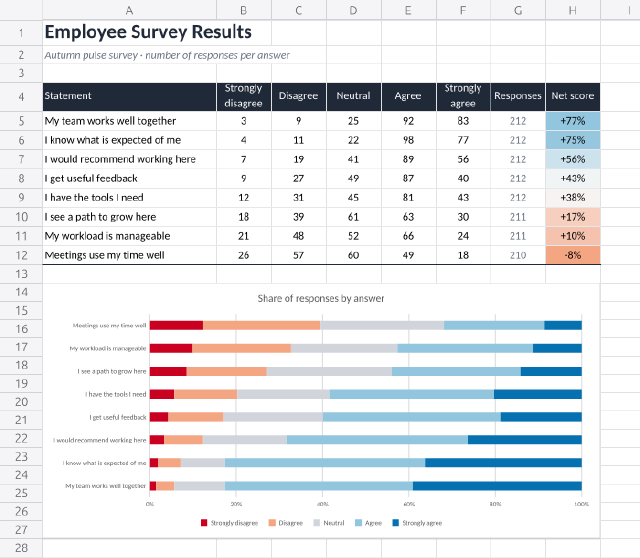
Employee Survey Results
Five-point agreement answers for eight survey statements, shown as a 100% stacked bar chart with a net-agreement score.