Investment Growth Projection
Twenty-five years of monthly saving projected with FV, split into money paid in and growth earned, with a line chart of the gap opening up.
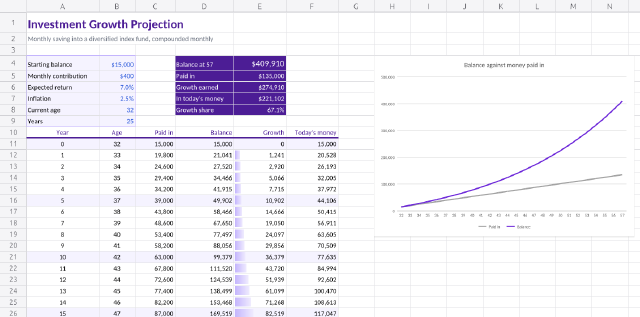
Five inputs: a starting balance, a monthly contribution, an expected return, inflation and the saver's age. Each year's balance is one FV call over the months so far; the contributions column grows in a straight line, so the space between the two lines on the chart is compound growth. The last column deflates every balance into today's money. The yearly rows are entered once and filled down; the age column is text (TEXT) so the chart reads it as its categories.
Steps
39 commandssteps:
- { command: range.setValues, params: { range: A1, values: [["Investment Growth Projection"], ["Monthly saving into a diversified index fund, compounded monthly"]] } }
- command: range.setValues
params:
range: A4
values:
- [Starting balance, 15000, null, "=\"Balance at \"&(B8+B9)", "=INDEX(D11:D36,B9+1)"]
- [Monthly contribution, 400, null, Paid in, "=INDEX(C11:C36,B9+1)"]
- [Expected return, 0.07, null, Growth earned, "=E4-E5"]
- [Inflation, 0.025, null, "In today's money", "=INDEX(F11:F36,B9+1)"]
- [Current age, 32, null, Growth share, "=E6/E4"]
- [Years, 25]
- { command: range.setValues, params: { range: A10, values: [[Year, Age, Paid in, Balance, Growth, "Today's money"]] } }
- command: range.setValues
params:
range: A11
values:
- [0, "=TEXT($B$8+A11,\"0\")", "=$B$4+$B$5*12*A11", "=FV($B$6/12,A11*12,-$B$5,-$B$4)", "=D11-C11", "=D11/(1+$B$7)^A11"]
- ["=A11+1", "=TEXT($B$8+A12,\"0\")", "=$B$4+$B$5*12*A12", "=FV($B$6/12,A12*12,-$B$5,-$B$4)", "=D12-C12", "=D12/(1+$B$7)^A12"]
- { command: edit.fillDown, params: { range: "A12:F36" } }
- { command: home.fontSize, params: { range: A1, size: 20 } }
- { command: home.bold, params: { range: A1 } }
- { command: home.fontColor, params: { range: A1, color: "#4c1d95" } }
- { command: home.fontColor, params: { range: A2, color: "#6b7280" } }
- { command: home.fontColor, params: { range: "B4:B9", color: "#1d4ed8" } }
- { command: home.fillColor, params: { range: "A4:B9", color: "#f5f3ff" } }
- { command: home.borders, params: { range: "A4:B9", preset: outside, color: "#c4b5fd" } }
- { command: home.numberFormat, params: { range: "B4:B5", format: "$$#,##0" } }
- { command: home.numberFormat, params: { range: "B6:B7", format: "0.0%" } }
- { command: home.fillColor, params: { range: "D4:E8", color: "#4c1d95" } }
- { command: home.fontColor, params: { range: "D4:E8", color: "#ffffff" } }
- { command: home.bold, params: { range: "E4:E8" } }
- { command: home.numberFormat, params: { range: "E4:E7", format: "$$#,##0" } }
- { command: home.numberFormat, params: { range: "E8", format: "0.0%" } }
- { command: home.fontSize, params: { range: "E4", size: 14 } }
- { command: home.bold, params: { range: "A10:F10" } }
- { command: home.fontColor, params: { range: "A10:F10", color: "#4c1d95" } }
- { command: home.borders, params: { range: "A10:F10", preset: bottom, style: medium, color: "#4c1d95" } }
- { command: home.alignCenter, params: { range: "A10:B36" } }
- { command: home.alignRight, params: { range: "C10:F10" } }
- { command: home.numberFormat, params: { range: "C11:F36", format: "#,##0" } }
- { command: home.conditionalFormat, params: { range: "A11:F36", rule: { type: expression, formula: "=MOD($A11,5)=0", style: { fill: { fg: { Rgb: 16118783 }, pattern: Solid } } } } }
- { command: home.conditionalFormat, params: { range: "E11:E36", rule: { type: dataBar, color: "#c4b5fd" } } }
- { command: home.columnWidth, params: { cols: "A:A", width: 128 } }
- { command: home.columnWidth, params: { cols: "B:B", width: 64 } }
- { command: home.columnWidth, params: { cols: "C:C", width: 70 } }
- { command: home.columnWidth, params: { cols: "D:D", width: 104 } }
- { command: home.columnWidth, params: { cols: "E:F", width: 92 } }
- { command: insert.chart, params: { range: "B10:D36", type: line }, as: chart }
- { command: chart.set, params: { title: Balance against money paid in, legend: bottom, at: H4, width: 460, height: 320 } }
- { command: chart.formatSelection, params: { series: 0, color: "#a3a3a3" } }
- { command: chart.formatSelection, params: { series: 1, color: "#6d28d9" } }
- { command: sheet.read, params: { range: "D4:E8" }, as: summary }
- { command: sheet.read, params: { range: "A21:F21" }, as: year10 }Checks
4 checks on every buildresults.summary.values= [["Balance at 57",{"approx":409909.9503488,"tol":0.0001}],["Paid in",135000],["Growth earned",{"approx":274909.9503488,"tol":0.0001}],["In today's money",{"a…results.year10.values.0= [10,"42",63000,{"approx":99378.8436238,"tol":0.0001},{"approx":36378.8436238,"tol":0.0001},{"approx":77634.5938043,"tol":0.0001}]- Diagnostics: none, the kit's own check finds nothing wrong
- The saved document opens again, and its thumbnail matches
thumb.pngwithin the render tolerance
Related
More Sheet samples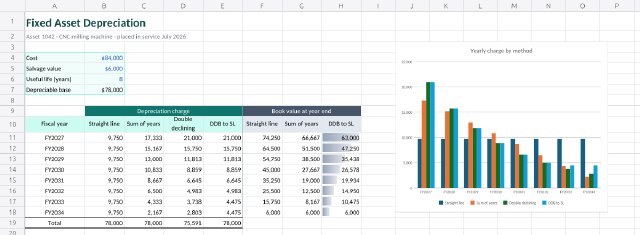
Depreciation Schedule
One machine depreciated four ways, with SLN, SYD, DDB and VDB side by side and the book value each leaves behind.
Loan Amortization Schedule
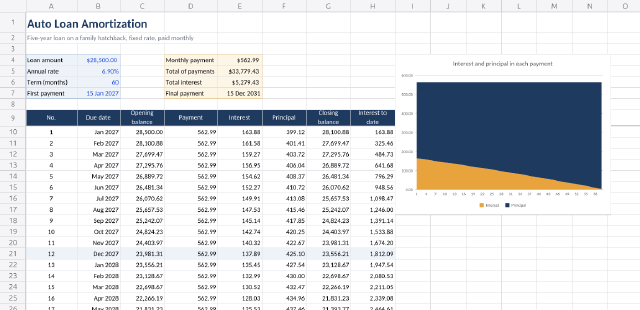
A five-year car loan paid off month by month, with PMT, IPMT and PPMT splitting every payment into interest and principal.
Project Appraisal (NPV & IRR)
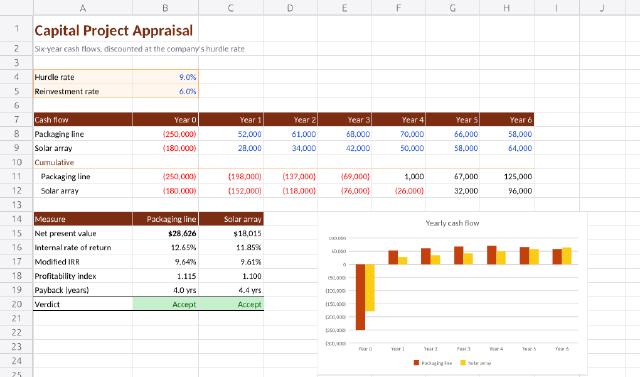
Two capital projects compared on NPV, IRR, MIRR, profitability index and payback, with a verdict for each.
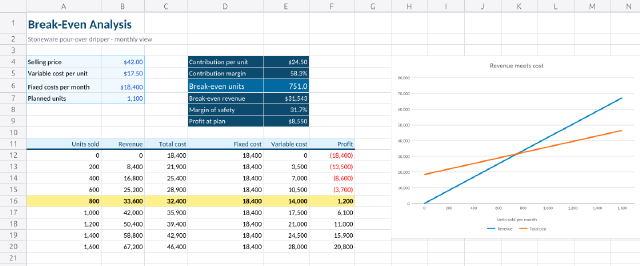
Break-Even Analysis
How many coffee drippers a small pottery has to sell each month to cover its costs, with the revenue and cost lines crossing on a chart.