Department Expense Subtotals
A month of expense claims sorted by department, with automatic subtotal rows, a grand total and an outline to collapse the detail.
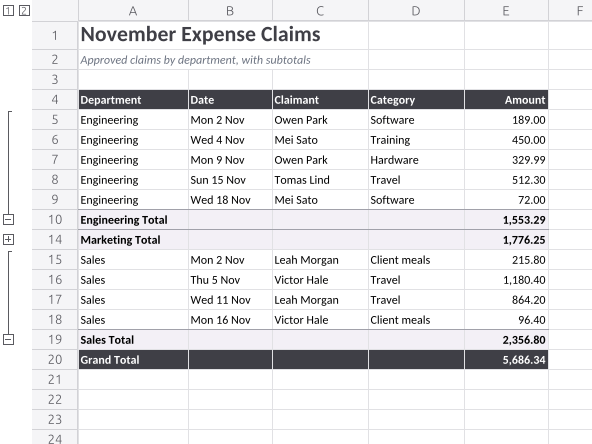
The claims are sorted by department and then Subtotal inserts a SUBTOTAL(9, …) row after each department and a grand total at the end, grouping the detail rows into an outline. The subtotal rows are styled after the fact with a formula rule that finds the word "Total", so they stand out however many rows each department has. Marketing's detail is collapsed in the outline, so only its subtotal row shows.
Steps
32 commandssteps:
- command: range.setValues
params:
range: A4
values:
- [Department, Date, Claimant, Category, Amount]
- [Marketing, 46327, Nadia Brandt, Travel, 642.5]
- [Engineering, 46328, Owen Park, Software, 189]
- [Sales, 46328, Leah Morgan, Client meals, 215.8]
- [Engineering, 46330, Mei Sato, Training, 450]
- [Sales, 46331, Victor Hale, Travel, 1180.4]
- [Marketing, 46334, Ravi Kumar, Events, 975]
- [Engineering, 46335, Owen Park, Hardware, 329.99]
- [Sales, 46337, Leah Morgan, Travel, 864.2]
- [Marketing, 46338, Nadia Brandt, Printing, 158.75]
- [Engineering, 46341, Tomas Lind, Travel, 512.3]
- [Sales, 46342, Victor Hale, Client meals, 96.4]
- [Engineering, 46344, Mei Sato, Software, 72]
- { command: data.sort, params: { range: "A4:E16", header: true, keys: [{ column: A, order: asc }, { column: B, order: asc }] } }
- { command: data.subtotal, params: { range: "A4:E16", groupBy: A, function: sum, columns: [E], header: true }, as: subtotal }
- { command: range.setValues, params: { range: A1, values: [["November Expense Claims"], ["Approved claims by department, with subtotals"]] } }
- { command: home.fontSize, params: { range: A1, size: 20 } }
- { command: home.bold, params: { range: A1, on: true } }
- { command: home.fontColor, params: { range: A1, color: "#3f3f46" } }
- { command: home.italic, params: { range: A2, on: true } }
- { command: home.fontColor, params: { range: A2, color: "#6b7280" } }
- { command: home.fillColor, params: { range: "A4:E4", color: "#3f3f46" } }
- { command: home.fontColor, params: { range: "A4:E4", color: "#ffffff" } }
- { command: home.bold, params: { range: "A4:E4", on: true } }
- { command: home.alignRight, params: { range: "E4" } }
- { command: home.numberFormat, params: { range: "B5:B19", format: "ddd d mmm" } }
- { command: home.alignLeft, params: { range: "B5:B19" } }
- { command: home.numberFormat, params: { range: "E5:E20", format: "#,##0.00" } }
- { command: home.conditionalFormat, params: { range: "A5:E19", rule: { type: expression, formula: "=ISNUMBER(SEARCH(\"Total\",$A5))", style: { font: { bold: true }, fill: { fg: { Rgb: 15986934 }, pattern: Solid } } } } }
- { command: home.borders, params: { range: "A10:E10", preset: top, color: "#a1a1aa" } }
- { command: home.borders, params: { range: "A14:E14", preset: top, color: "#a1a1aa" } }
- { command: home.borders, params: { range: "A19:E19", preset: top, color: "#a1a1aa" } }
- { command: home.bold, params: { range: "A20:E20", on: true } }
- { command: home.fillColor, params: { range: "A20:E20", color: "#3f3f46" } }
- { command: home.fontColor, params: { range: "A20:E20", color: "#ffffff" } }
- { command: home.columnWidth, params: { cols: "A:A", width: 110 } }
- { command: home.columnWidth, params: { cols: "B:B", width: 84 } }
- { command: home.columnWidth, params: { cols: "C:D", width: 96 } }
- { command: home.columnWidth, params: { cols: "E:E", width: 84 } }
- { command: home.rowHeight, params: { rows: "1:1", height: 28 } }
- { command: data.hideDetail, params: { rows: "11:13" } }
- { command: sheet.read, params: { range: "A4:E20" }, as: list }
- { command: sheet.read, params: { range: "E10:E20", formulas: true }, as: formulas }
- { command: document.inspect, params: {}, as: doc }Checks
11 checks on every buildresults.subtotal.groups= 3results.list.values= {"count":17}results.list.values.6= ["Engineering Total",null,null,null,{"approx":1553.29,"tol":0.001}]results.list.values.10= ["Marketing Total",null,null,null,1776.25]results.list.values.15= ["Sales Total",null,null,null,{"approx":2356.8,"tol":0.001}]results.list.values.16= ["Grand Total",null,null,null,{"approx":5686.34,"tol":0.001}]results.formulas.values.0.0= {"matches":"^=SUBTOTAL\\(9,"}results.formulas.values.10.0= {"matches":"^=SUBTOTAL\\(9,"}results.doc.sheets.0.usedRange= "A1:E20"- Diagnostics: none, the kit's own check finds nothing wrong
- The saved document opens again, and its thumbnail matches
thumb.pngwithin the render tolerance
Related
More Sheet samples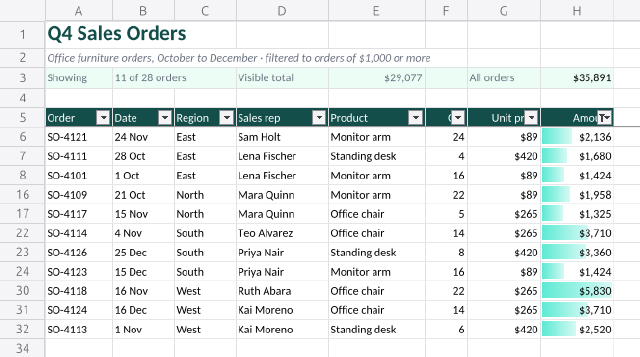
Filtered Sales Orders
A quarter's order list sorted by region and amount, with an AutoFilter that keeps only orders of $1,000 or more.
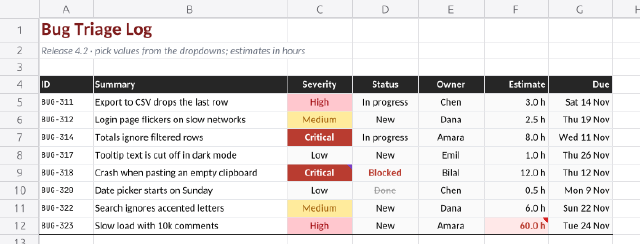
Bug Triage Log
A triage sheet with dropdown lists for severity, status and owner, number and date rules, input messages and review notes.
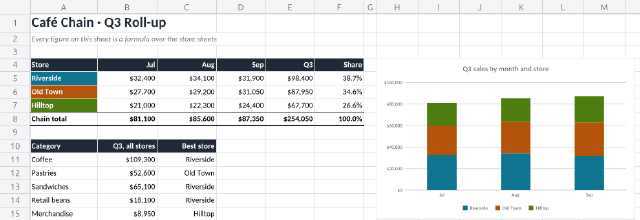
Café Chain Quarterly Roll-up
Three store sheets with coloured tabs feed a summary sheet through cross-sheet and 3-D references.
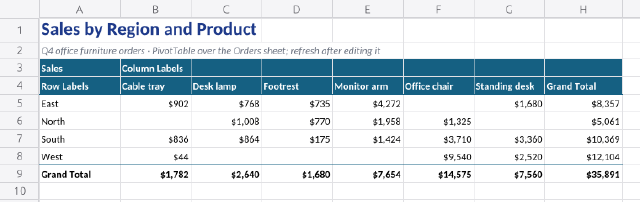
Orders Pivot Summary
A PivotTable that turns a quarter's order list into sales by region and product, with grand totals.