Market Share Doughnut
Unit sales of five coffee brands turned into shares, a change-in-points column and a labelled doughnut chart.
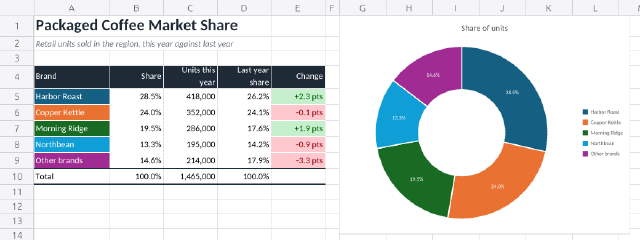
Shares are formulas over the unit totals, so the doughnut and the table always agree. The change column subtracts last year's share and shows it in percentage points with a custom format that adds a sign and a "pts" suffix; rules colour gains green and losses red. The brand names carry the colour of their slice, so the table doubles as the chart's legend.
Steps
40 commandssteps:
- { command: range.setValues, params: { range: A1, values: [["Packaged Coffee Market Share"], ["Retail units sold in the region, this year against last year"]] } }
- command: range.setValues
params:
range: A4
values:
- [Brand, Share, Units this year, Last year share, Change]
- [Harbor Roast, "=C5/$C$10", 418000, 0.262, "=(B5-D5)*100"]
- [Copper Kettle, "=C6/$C$10", 352000, 0.241, "=(B6-D6)*100"]
- [Morning Ridge, "=C7/$C$10", 286000, 0.176, "=(B7-D7)*100"]
- [Northbean, "=C8/$C$10", 195000, 0.142, "=(B8-D8)*100"]
- [Other brands, "=C9/$C$10", 214000, 0.179, "=(B9-D9)*100"]
- [Total, "=SUM(B5:B9)", "=SUM(C5:C9)", "=SUM(D5:D9)", null]
- { command: home.fontSize, params: { range: A1, size: 20 } }
- { command: home.bold, params: { range: A1 } }
- { command: home.fontColor, params: { range: A1, color: "#1f2a37" } }
- { command: home.italic, params: { range: A2 } }
- { command: home.fontColor, params: { range: A2, color: "#6b7280" } }
- { command: home.fillColor, params: { range: "A4:E4", color: "#1f2a37" } }
- { command: home.fontColor, params: { range: "A4:E4", color: "#ffffff" } }
- { command: home.bold, params: { range: "A4:E4" } }
- { command: home.wrapText, params: { range: "A4:E4" } }
- { command: home.alignRight, params: { range: "B4:E4" } }
- { command: home.alignMiddle, params: { range: "A4:E10" } }
- { command: home.numberFormat, params: { range: "C5:C10", format: "#,##0" } }
- { command: home.numberFormat, params: { range: "B5:B10", format: "0.0%" } }
- { command: home.numberFormat, params: { range: "D5:D10", format: "0.0%" } }
- { command: home.numberFormat, params: { range: "E5:E9", format: "+0.0\" pts\";-0.0\" pts\";0.0\" pts\"" } }
- { command: home.conditionalFormat, params: { range: "E5:E9", rule: { type: expression, formula: "=E5>0", preset: greenFill } } }
- { command: home.conditionalFormat, params: { range: "E5:E9", rule: { type: expression, formula: "=E5<0", preset: lightRedFillDarkRedText } } }
- { command: home.fillColor, params: { range: "A5", color: "#156082" } }
- { command: home.fillColor, params: { range: "A6", color: "#e97132" } }
- { command: home.fillColor, params: { range: "A7", color: "#196b24" } }
- { command: home.fillColor, params: { range: "A8", color: "#0f9ed5" } }
- { command: home.fillColor, params: { range: "A9", color: "#a02b93" } }
- { command: home.fontColor, params: { range: "A5:A9", color: "#ffffff" } }
- { command: home.bold, params: { range: "A5:A9" } }
- { command: home.borders, params: { range: "A5:E9", preset: insideHorizontal, color: "#ffffff" } }
- { command: home.bold, params: { range: "A10:E10" } }
- { command: home.borders, params: { range: "A10:E10", preset: topDoubleBottom, color: "#1f2a37" } }
- { command: home.columnWidth, params: { cols: "A:A", width: 104 } }
- { command: home.columnWidth, params: { cols: "B:E", width: 74 } }
- { command: home.columnWidth, params: { cols: "F:F", width: 20 } }
- { command: home.rowHeight, params: { rows: "1:1", height: 28 } }
- { command: home.rowHeight, params: { rows: "4:4", height: 32 } }
- { command: home.rowHeight, params: { rows: "5:10", height: 22 } }
- { command: insert.chart, params: { range: "A4:B9", type: doughnut, at: G1, width: 400, height: 300 }, as: chart }
- { command: chart.set, params: { title: Share of units, legend: right, dataLabels: true } }
- { command: drawing.describe, params: {}, as: drawing }
- { command: sheet.read, params: { range: "B5:B10" }, as: shares }
- { command: sheet.read, params: { range: "E5:E9", formatted: true }, as: change }Checks
9 checks on every buildresults.drawing.objects.0.chart.kind= "doughnut"results.drawing.objects.0.chart.dataLabels= trueresults.drawing.objects.0.chart.series.0.name= "Share"results.drawing.objects.0.chart.series.0.values= {"count":5}results.shares.values.0.0= {"approx":0.285324,"tol":0.00001}results.shares.values.5.0= 1results.change.values= [["+2.3 pts"],["-0.1 pts"],["+1.9 pts"],["-0.9 pts"],["-3.3 pts"]]- Diagnostics: none, the kit's own check finds nothing wrong
- The saved document opens again, and its thumbnail matches
thumb.pngwithin the render tolerance
Related
More Sheet samples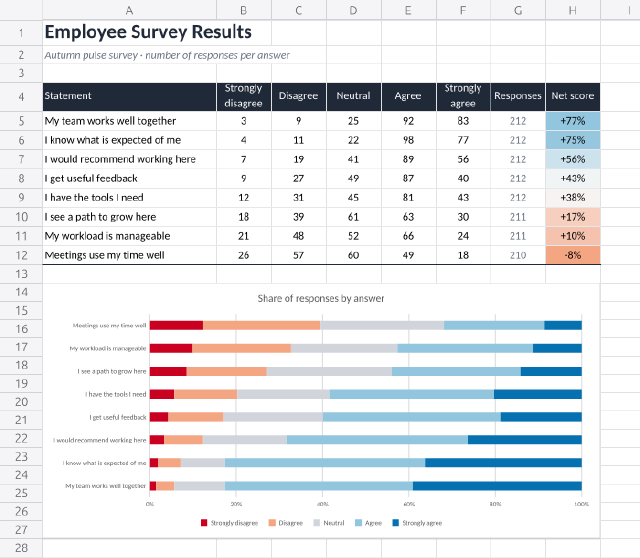
Employee Survey Results
Five-point agreement answers for eight survey statements, shown as a 100% stacked bar chart with a net-agreement score.
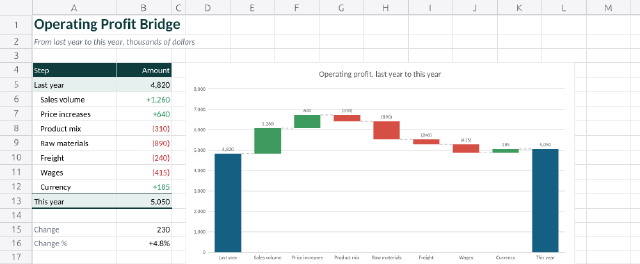
Profit Bridge Waterfall
A waterfall chart that walks operating profit from last year to this year through its drivers.
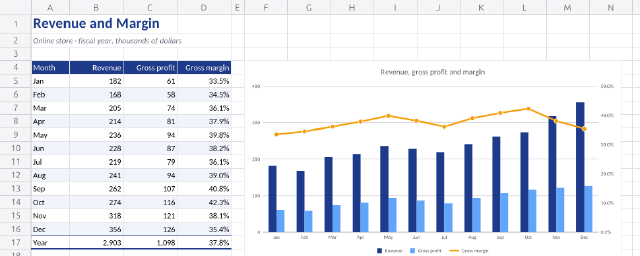
Revenue and Margin Combo
Monthly revenue and gross profit as columns with gross margin as a line on a secondary axis.
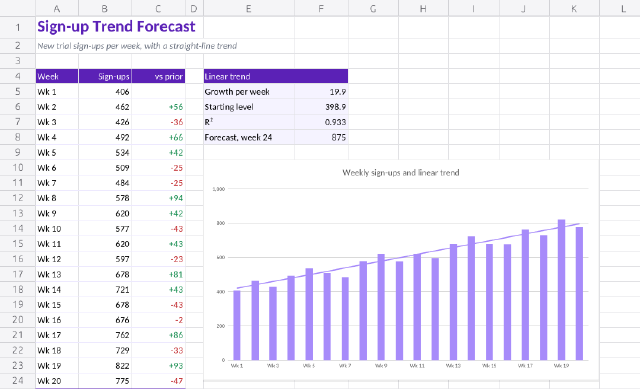
Sign-up Trend Forecast
Twenty weeks of trial sign-ups as columns with a linear trendline, the fit worked out in cells and a week-24 forecast.