Household Budget
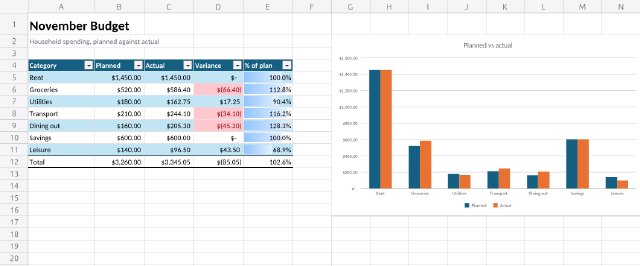
A monthly budget with planned and actual spending, variance formulas, a total row and a column chart.
Steps
18 commandssteps:
- { command: range.setValues, params: { range: A1, values: [["November Budget"], ["Household spending, planned against actual"]] } }
- command: range.setValues
params:
range: A4
values:
- [Category, Planned, Actual, Variance, "% of plan"]
- [Rent, 1450, 1450, "=B5-C5", "=C5/B5"]
- [Groceries, 520, 586.4, "=B6-C6", "=C6/B6"]
- [Utilities, 180, 162.75, "=B7-C7", "=C7/B7"]
- [Transport, 210, 244.1, "=B8-C8", "=C8/B8"]
- [Dining out, 160, 205.3, "=B9-C9", "=C9/B9"]
- [Savings, 600, 600, "=B10-C10", "=C10/B10"]
- [Leisure, 140, 96.5, "=B11-C11", "=C11/B11"]
- [Total, "=SUM(B5:B11)", "=SUM(C5:C11)", "=B12-C12", "=C12/B12"]
# Carlito (Calibri's metrics, from kition-fonts) so the grid draws the same on every machine.
- { command: home.fontName, params: { range: "A1:E12", name: Carlito } }
- { command: home.fontSize, params: { range: A1, size: 20 } }
- { command: home.bold, params: { range: A1 } }
- { command: home.fontColor, params: { range: A2, color: "#6b7280" } }
- { command: home.formatAsTable, params: { range: "A4:E11", style: TableStyleMedium2 } }
- { command: home.accounting, params: { range: "B5:D12" } }
- { command: home.numberFormat, params: { range: "E5:E12", format: "0.0%" } }
- { command: home.bold, params: { range: "A12:E12" } }
- { command: home.borders, params: { range: "A12:E12", preset: topDoubleBottom } }
- { command: home.conditionalFormat, params: { range: "D5:D11", rule: { type: expression, formula: "=D5<0", preset: lightRedFillDarkRedText } } }
- { command: home.columnWidth, params: { cols: "A:A", width: 110 } }
- { command: home.columnWidth, params: { cols: "B:E", width: 82 } }
- { command: insert.chart, params: { range: "A4:C11", type: column, subtype: clustered }, as: chart }
- { command: chart.set, params: { title: Planned vs actual, legend: bottom, at: G2, width: 520, height: 300 } }
- { command: home.conditionalFormat, params: { range: "E5:E11", rule: { type: dataBar, color: "#93c5fd" } } }
- { command: sheet.read, params: { range: "B12:E12" }, as: totals }Checks
3 checks on every buildresults.totals.values.0= [3260,3345.05,{"approx":-85.05,"tol":0.001},{"approx":1.0260889,"tol":0.000001}]- Diagnostics: none, the kit's own check finds nothing wrong
- The saved document opens again, and its thumbnail matches
thumb.pngwithin the render tolerance
Related
More Sheet samples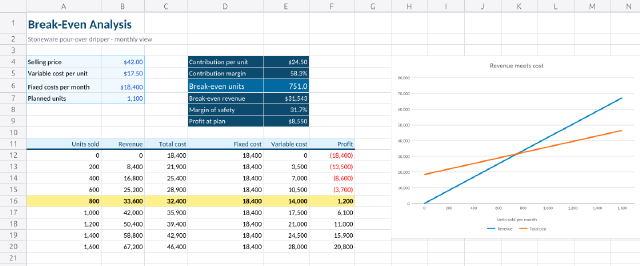
Break-Even Analysis
How many coffee drippers a small pottery has to sell each month to cover its costs, with the revenue and cost lines crossing on a chart.
1 sheet; used range A1:F20
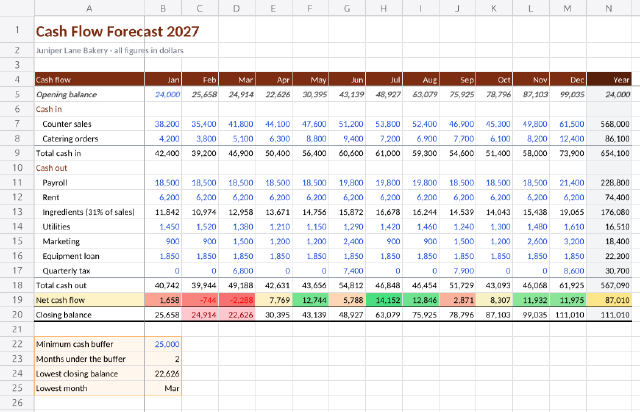
12-Month Cash Flow Forecast
A bakery's year of cash in and cash out, month by month, with running balances, a colour scale and a warning when cash dips under the buffer.
1 sheet; used range A1:N25
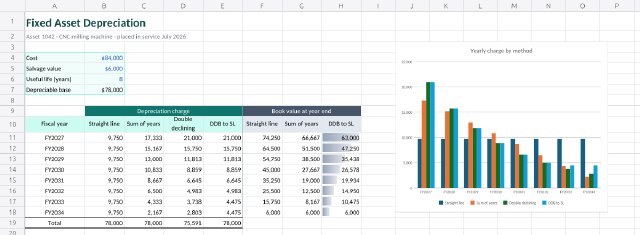
Depreciation Schedule
One machine depreciated four ways, with SLN, SYD, DDB and VDB side by side and the book value each leaves behind.
1 sheet; used range A1:H19
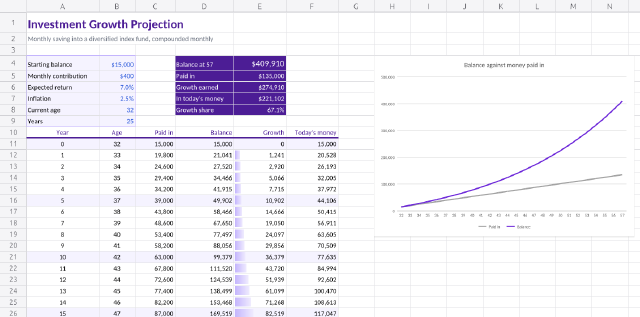
Investment Growth Projection
Twenty-five years of monthly saving projected with FV, split into money paid in and growth earned, with a line chart of the gap opening up.
1 sheet; used range A1:F36