Employee Survey Results
Five-point agreement answers for eight survey statements, shown as a 100% stacked bar chart with a net-agreement score.
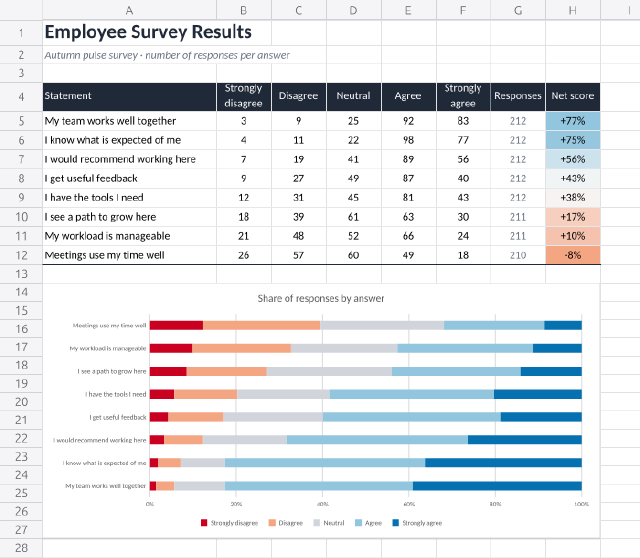
Each statement's answers run from Strongly disagree to Strongly agree. A 100% stacked bar chart turns the counts into proportions so statements with different response counts compare fairly, with a red-to-green palette that follows the scale. The net score (agree minus disagree, as a share of responses) gets a diverging colour scale, and the table is sorted so the strongest statement comes first.
Steps
30 commandssteps:
- { command: range.setValues, params: { range: A1, values: [["Employee Survey Results"], ["Autumn pulse survey · number of responses per answer"]] } }
- command: range.setValues
params:
range: A4
values:
- [Statement, Strongly disagree, Disagree, Neutral, Agree, Strongly agree, Responses, Net score]
- [I know what is expected of me, 4, 11, 22, 98, 77, "=SUM(B5:F5)", "=(E5+F5-B5-C5)/G5"]
- [I have the tools I need, 12, 31, 45, 81, 43, "=SUM(B6:F6)", "=(E6+F6-B6-C6)/G6"]
- [My workload is manageable, 21, 48, 52, 66, 24, "=SUM(B7:F7)", "=(E7+F7-B7-C7)/G7"]
- [I get useful feedback, 9, 27, 49, 87, 40, "=SUM(B8:F8)", "=(E8+F8-B8-C8)/G8"]
- [I see a path to grow here, 18, 39, 61, 63, 30, "=SUM(B9:F9)", "=(E9+F9-B9-C9)/G9"]
- [My team works well together, 3, 9, 25, 92, 83, "=SUM(B10:F10)", "=(E10+F10-B10-C10)/G10"]
- [Meetings use my time well, 26, 57, 60, 49, 18, "=SUM(B11:F11)", "=(E11+F11-B11-C11)/G11"]
- [I would recommend working here, 7, 19, 41, 89, 56, "=SUM(B12:F12)", "=(E12+F12-B12-C12)/G12"]
- { command: data.sort, params: { range: "A4:H12", header: true, keys: [{ column: H, order: desc }] } }
- { command: home.fontSize, params: { range: A1, size: 20 } }
- { command: home.bold, params: { range: A1 } }
- { command: home.fontColor, params: { range: A1, color: "#1f2937" } }
- { command: home.italic, params: { range: A2 } }
- { command: home.fontColor, params: { range: A2, color: "#6b7280" } }
- { command: home.fillColor, params: { range: "A4:H4", color: "#1f2937" } }
- { command: home.fontColor, params: { range: "A4:H4", color: "#ffffff" } }
- { command: home.bold, params: { range: "A4:H4" } }
- { command: home.wrapText, params: { range: "A4:H4" } }
- { command: home.alignCenter, params: { range: "B4:H12" } }
- { command: home.alignMiddle, params: { range: "A4:H12" } }
- { command: home.numberFormat, params: { range: "H5:H12", format: "+0%;-0%;0%" } }
- { command: home.conditionalFormat, params: { range: "H5:H12", rule: { type: colorScale, colors: ["#f4a582", "#f7f7f7", "#92c5de"] } } }
- { command: home.bold, params: { range: "H5:H12" } }
- { command: home.fontColor, params: { range: "G5:G12", color: "#6b7280" } }
- { command: home.borders, params: { range: "A5:H12", preset: insideHorizontal, color: "#e5e7eb" } }
- { command: home.borders, params: { range: "A12:H12", preset: bottom, color: "#1f2937" } }
- { command: home.columnWidth, params: { cols: "A:A", width: 190 } }
- { command: home.columnWidth, params: { cols: "B:H", width: 60 } }
- { command: home.rowHeight, params: { rows: "1:1", height: 28 } }
- { command: home.rowHeight, params: { rows: "4:4", height: 32 } }
- { command: home.rowHeight, params: { rows: "5:12", height: 21 } }
- { command: insert.chart, params: { range: "A4:F12", type: bar, subtype: stacked100, at: A14, width: 610, height: 280 }, as: chart }
- command: drawing.chart
params:
id: "1"
title: Share of responses by answer
legend: bottom
seriesFormat:
- { index: 0, color: "#ca0020" }
- { index: 1, color: "#f4a582" }
- { index: 2, color: "#d1d5db" }
- { index: 3, color: "#92c5de" }
- { index: 4, color: "#0571b0" }
- { command: drawing.describe, params: {}, as: drawing }
- { command: sheet.read, params: { range: "A5:A12" }, as: order }
- { command: sheet.read, params: { range: "G5:H5" }, as: top }Checks
7 checks on every buildresults.drawing.objects.0.chart.kind= "percentBar"results.drawing.objects.0.chart.series= {"count":5,"all":{"values":{"count":8}}}results.order.values.0.0= "My team works well together"results.order.values.7.0= "Meetings use my time well"results.top.values.0= [212,{"approx":0.768868,"tol":0.00001}]- Diagnostics: none, the kit's own check finds nothing wrong
- The saved document opens again, and its thumbnail matches
thumb.pngwithin the render tolerance
Related
More Sheet samples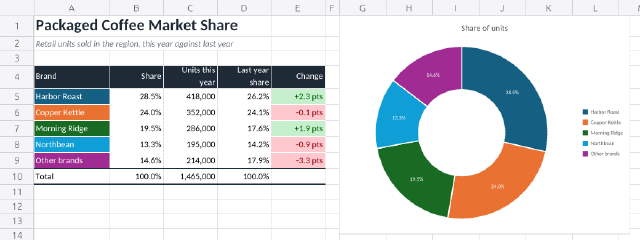
Market Share Doughnut
Unit sales of five coffee brands turned into shares, a change-in-points column and a labelled doughnut chart.
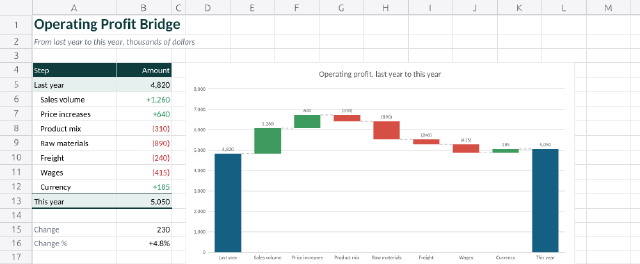
Profit Bridge Waterfall
A waterfall chart that walks operating profit from last year to this year through its drivers.
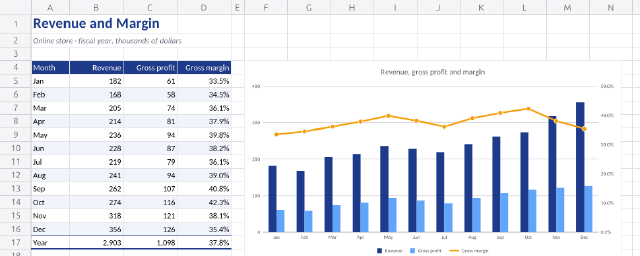
Revenue and Margin Combo
Monthly revenue and gross profit as columns with gross margin as a line on a secondary axis.
Sign-up Trend Forecast
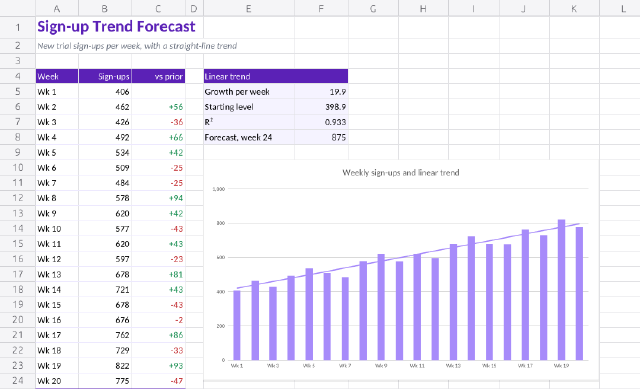
Twenty weeks of trial sign-ups as columns with a linear trendline, the fit worked out in cells and a week-24 forecast.