SUMIFS Regional Sales Summary
A quarter's deal log rolled up by region and product with SUMIFS, COUNTIFS, AVERAGEIFS and MAXIFS.
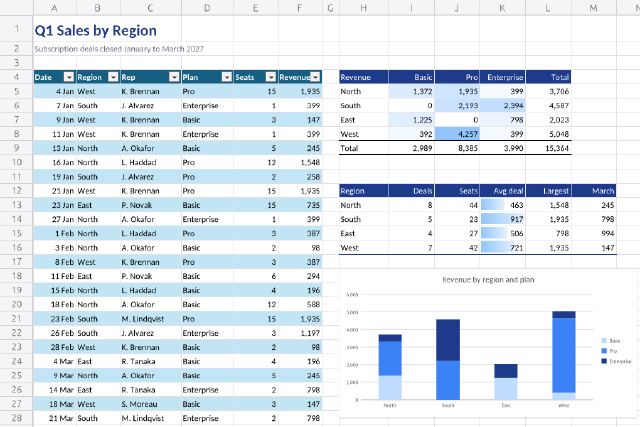
Twenty-four deals from the first quarter sit in a table on the left. The grid on the right adds them up by region and product with SUMIFS, using mixed references (`$H5`, `I$4`) so one formula fills the whole grid, and a colour scale shows where the money is. Below it, COUNTIFS, AVERAGEIFS and MAXIFS describe each region, and the March column adds a date criterion built from `">="&DATE(2027,3,1)`.
Steps
46 commandssteps:
- { command: range.setValues, params: { range: A1, values: [["Q1 Sales by Region"], ["Subscription deals closed January to March 2027"]] } }
- command: range.setValues
params:
range: A4
values:
- [Date, Region, Rep, Plan, Seats, Revenue]
- ["2027-01-04", West, K. Brennan, Pro, 15, 1935]
- ["2027-01-07", South, J. Alvarez, Enterprise, 1, 399]
- ["2027-01-09", West, K. Brennan, Basic, 3, 147]
- ["2027-01-11", West, K. Brennan, Enterprise, 1, 399]
- ["2027-01-13", North, A. Okafor, Basic, 5, 245]
- ["2027-01-16", North, L. Haddad, Pro, 12, 1548]
- ["2027-01-19", South, J. Alvarez, Pro, 2, 258]
- ["2027-01-21", West, K. Brennan, Pro, 15, 1935]
- ["2027-01-23", East, P. Novak, Basic, 15, 735]
- ["2027-01-27", North, A. Okafor, Enterprise, 1, 399]
- ["2027-02-01", North, L. Haddad, Pro, 3, 387]
- ["2027-02-03", North, A. Okafor, Basic, 2, 98]
- ["2027-02-08", West, K. Brennan, Pro, 3, 387]
- ["2027-02-11", East, P. Novak, Basic, 6, 294]
- ["2027-02-15", North, L. Haddad, Basic, 4, 196]
- ["2027-02-18", North, A. Okafor, Basic, 12, 588]
- ["2027-02-23", South, M. Lindqvist, Pro, 15, 1935]
- ["2027-02-26", South, J. Alvarez, Enterprise, 3, 1197]
- ["2027-02-28", West, K. Brennan, Basic, 2, 98]
- ["2027-03-04", East, R. Tanaka, Basic, 4, 196]
- ["2027-03-09", North, A. Okafor, Basic, 5, 245]
- ["2027-03-14", East, R. Tanaka, Enterprise, 2, 798]
- ["2027-03-18", West, S. Moreau, Basic, 3, 147]
- ["2027-03-21", South, M. Lindqvist, Enterprise, 2, 798]
- { command: home.formatAsTable, params: { range: "A4:F28", style: TableStyleMedium2 } }
- { command: home.numberFormat, params: { range: "A5:A28", format: "d mmm" } }
- { command: home.numberFormat, params: { range: "F5:F28", format: "#,##0" } }
- command: range.setValues
params:
range: H4
values:
- [Revenue, Basic, Pro, Enterprise, Total]
- [North, "=SUMIFS($F$5:$F$28,$B$5:$B$28,$H5,$D$5:$D$28,I$4)", "=SUMIFS($F$5:$F$28,$B$5:$B$28,$H5,$D$5:$D$28,J$4)", "=SUMIFS($F$5:$F$28,$B$5:$B$28,$H5,$D$5:$D$28,K$4)", "=SUM(I5:K5)"]
- [South, "=SUMIFS($F$5:$F$28,$B$5:$B$28,$H6,$D$5:$D$28,I$4)", "=SUMIFS($F$5:$F$28,$B$5:$B$28,$H6,$D$5:$D$28,J$4)", "=SUMIFS($F$5:$F$28,$B$5:$B$28,$H6,$D$5:$D$28,K$4)", "=SUM(I6:K6)"]
- [East, "=SUMIFS($F$5:$F$28,$B$5:$B$28,$H7,$D$5:$D$28,I$4)", "=SUMIFS($F$5:$F$28,$B$5:$B$28,$H7,$D$5:$D$28,J$4)", "=SUMIFS($F$5:$F$28,$B$5:$B$28,$H7,$D$5:$D$28,K$4)", "=SUM(I7:K7)"]
- [West, "=SUMIFS($F$5:$F$28,$B$5:$B$28,$H8,$D$5:$D$28,I$4)", "=SUMIFS($F$5:$F$28,$B$5:$B$28,$H8,$D$5:$D$28,J$4)", "=SUMIFS($F$5:$F$28,$B$5:$B$28,$H8,$D$5:$D$28,K$4)", "=SUM(I8:K8)"]
- [Total, "=SUM(I5:I8)", "=SUM(J5:J8)", "=SUM(K5:K8)", "=SUM(L5:L8)"]
- command: range.setValues
params:
range: H12
values:
- [Region, Deals, Seats, Avg deal, Largest, March]
- [North, "=COUNTIFS($B$5:$B$28,H13)", "=SUMIFS($E$5:$E$28,$B$5:$B$28,H13)", "=AVERAGEIFS($F$5:$F$28,$B$5:$B$28,H13)", "=MAXIFS($F$5:$F$28,$B$5:$B$28,H13)", "=SUMIFS($F$5:$F$28,$B$5:$B$28,H13,$A$5:$A$28,\">=\"&DATE(2027,3,1))"]
- [South, "=COUNTIFS($B$5:$B$28,H14)", "=SUMIFS($E$5:$E$28,$B$5:$B$28,H14)", "=AVERAGEIFS($F$5:$F$28,$B$5:$B$28,H14)", "=MAXIFS($F$5:$F$28,$B$5:$B$28,H14)", "=SUMIFS($F$5:$F$28,$B$5:$B$28,H14,$A$5:$A$28,\">=\"&DATE(2027,3,1))"]
- [East, "=COUNTIFS($B$5:$B$28,H15)", "=SUMIFS($E$5:$E$28,$B$5:$B$28,H15)", "=AVERAGEIFS($F$5:$F$28,$B$5:$B$28,H15)", "=MAXIFS($F$5:$F$28,$B$5:$B$28,H15)", "=SUMIFS($F$5:$F$28,$B$5:$B$28,H15,$A$5:$A$28,\">=\"&DATE(2027,3,1))"]
- [West, "=COUNTIFS($B$5:$B$28,H16)", "=SUMIFS($E$5:$E$28,$B$5:$B$28,H16)", "=AVERAGEIFS($F$5:$F$28,$B$5:$B$28,H16)", "=MAXIFS($F$5:$F$28,$B$5:$B$28,H16)", "=SUMIFS($F$5:$F$28,$B$5:$B$28,H16,$A$5:$A$28,\">=\"&DATE(2027,3,1))"]
- { command: home.fontSize, params: { range: A1, size: 20 } }
- { command: home.bold, params: { range: A1 } }
- { command: home.fontColor, params: { range: A1, color: "#1e3a8a" } }
- { command: home.fontColor, params: { range: A2, color: "#6b7280" } }
- { command: home.fillColor, params: { range: "H4:L4", color: "#1e3a8a" } }
- { command: home.fillColor, params: { range: "H12:M12", color: "#1e3a8a" } }
- { command: home.fontColor, params: { range: "H4:L4", color: "#ffffff" } }
- { command: home.fontColor, params: { range: "H12:M12", color: "#ffffff" } }
- { command: home.bold, params: { range: "H4:L4" } }
- { command: home.bold, params: { range: "H12:M12" } }
- { command: home.alignRight, params: { range: "I4:L4" } }
- { command: home.alignRight, params: { range: "I12:M12" } }
- { command: home.bold, params: { range: "H5:H9" } }
- { command: home.bold, params: { range: "H13:H16" } }
- { command: home.numberFormat, params: { range: "I5:L9", format: "#,##0" } }
- { command: home.numberFormat, params: { range: "K13:M16", format: "#,##0" } }
- { command: home.conditionalFormat, params: { range: "I5:K8", rule: { type: colorScale, colors: ["#ffffff", "#93c5fd"] } } }
- { command: home.bold, params: { range: "H9:L9" } }
- { command: home.bold, params: { range: "L5:L8" } }
- { command: home.borders, params: { range: "H9:L9", preset: topDoubleBottom } }
- { command: home.borders, params: { range: "H5:L8", preset: insideHorizontal, color: "#e5e7eb" } }
- { command: home.borders, params: { range: "H13:M16", preset: insideHorizontal, color: "#e5e7eb" } }
- { command: home.borders, params: { range: "H16:M16", preset: bottom, color: "#1e3a8a" } }
- { command: home.conditionalFormat, params: { range: "K13:K16", rule: { type: dataBar, color: "#93c5fd" } } }
- { command: home.columnWidth, params: { cols: "A:A", width: 60 } }
- { command: home.columnWidth, params: { cols: "B:B", width: 62 } }
- { command: home.columnWidth, params: { cols: "C:C", width: 86 } }
- { command: home.columnWidth, params: { cols: "D:D", width: 74 } }
- { command: home.columnWidth, params: { cols: "E:F", width: 62 } }
- { command: home.columnWidth, params: { cols: "G:G", width: 24 } }
- { command: home.columnWidth, params: { cols: "H:H", width: 70 } }
- { command: home.columnWidth, params: { cols: "I:M", width: 64 } }
- { command: insert.chart, params: { range: "H4:K8", type: column, subtype: stacked }, as: chart }
- { command: chart.set, params: { title: Revenue by region and plan, legend: right, at: H18, width: 420, height: 210 } }
- { command: chart.formatSelection, params: { series: 0, color: "#bfdbfe" } }
- { command: chart.formatSelection, params: { series: 1, color: "#3b82f6" } }
- { command: chart.formatSelection, params: { series: 2, color: "#1e3a8a" } }
- { command: sheet.read, params: { range: "I5:L9" }, as: grid }
- { command: sheet.read, params: { range: "I13:M16" }, as: stats }Checks
4 checks on every buildresults.grid.values= [[1372,1935,399,3706],[0,2193,2394,4587],[1225,0,798,2023],[392,4257,399,5048],[2989,8385,3990,15364]]results.stats.values= [[8,44,463.25,1548,245],[5,23,917.4,1935,798],[4,27,505.75,798,994],[7,42,{"approx":721.1428571,"tol":0.000001},1935,147]]- Diagnostics: none, the kit's own check finds nothing wrong
- The saved document opens again, and its thumbnail matches
thumb.pngwithin the render tolerance
Related
More Sheet samples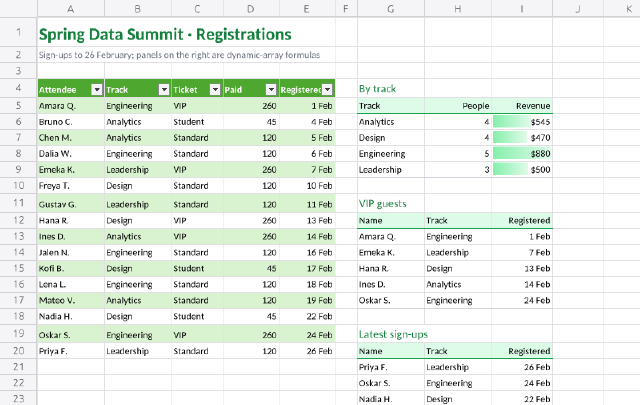
Dynamic Array Event Report
Three spilling summaries of a conference sign-up list, built with UNIQUE, SORT, FILTER, SORTBY, CHOOSECOLS and TAKE.
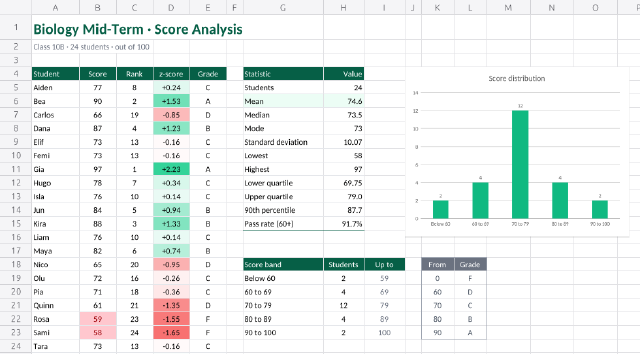
Exam Score Statistics
A class's test scores described with AVERAGE, MEDIAN, MODE, STDEV, QUARTILE and PERCENTILE, binned with FREQUENCY into a histogram.
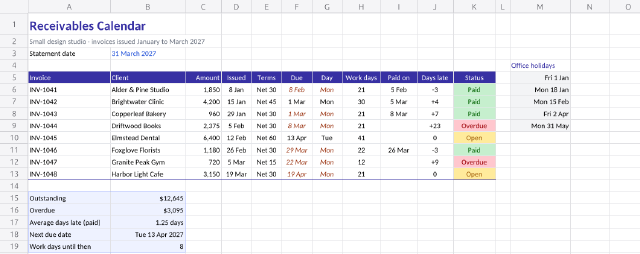
Invoice Due-Date Tracker
Due dates that skip weekends and office holidays with WORKDAY, business days with NETWORKDAYS, and a status for every invoice.
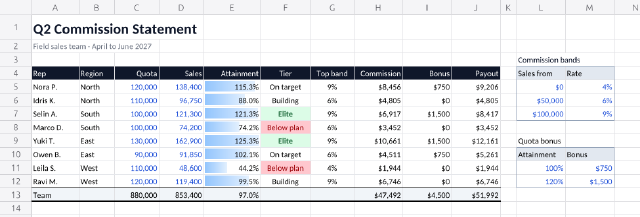
Sales Commission Calculator
Quarterly payouts for eight reps with tiered marginal commission from a named LAMBDA, VLOOKUP rate bands and IFS bonuses.