Regional Sales Heat Map
Twelve months of sales for ten regions, shaded by a three-colour scale so the peaks and the quiet months stand out.
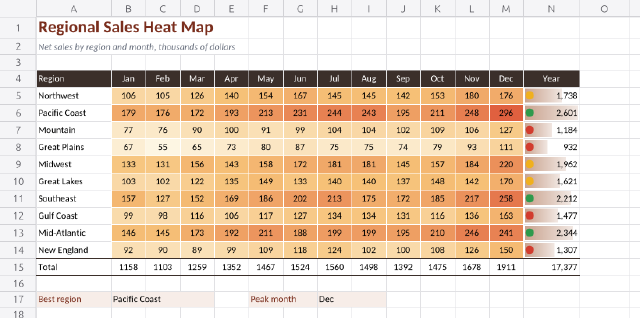
A colour scale runs from pale sand through amber to deep coral across every monthly figure, so the holiday peak in November and December and the weaker winter months read at a glance. Row and column totals are SUM formulas. The year column carries data bars and a traffic-light icon set that splits the regions into top, middle and bottom thirds, and INDEX/MATCH formulas name the best region and the peak month.
Steps
41 commandssteps:
- { command: range.setValues, params: { range: A1, values: [["Regional Sales Heat Map"], ["Net sales by region and month, thousands of dollars"]] } }
- command: range.setValues
params:
range: A4
values:
- [Region, Jan, Feb, Mar, Apr, May, Jun, Jul, Aug, Sep, Oct, Nov, Dec, Year]
- ["Northwest", 106.0, 104.8, 125.5, 140.2, 154.2, 167.2, 145.0, 145.1, 142.0, 153.0, 179.6, 175.7, "=SUM(B5:M5)"]
- ["Pacific Coast", 178.7, 175.9, 172.3, 193.0, 212.7, 231.2, 243.8, 242.9, 195.2, 210.8, 248.1, 296.2, "=SUM(B6:M6)"]
- ["Mountain", 76.5, 75.5, 90.1, 100.4, 90.6, 98.7, 104.3, 104.2, 101.8, 109.4, 105.7, 126.5, "=SUM(B7:M7)"]
- ["Great Plains", 67.0, 54.5, 65.1, 72.7, 79.9, 86.6, 75.0, 75.1, 73.6, 79.2, 92.9, 110.6, "=SUM(B8:M8)"]
- ["Midwest", 133.1, 131.1, 156.2, 143.4, 158.1, 171.8, 181.3, 180.7, 145.0, 156.6, 184.3, 219.9, "=SUM(B9:M9)"]
- ["Great Lakes", 103.1, 101.8, 121.5, 135.4, 148.6, 132.8, 140.4, 140.4, 137.2, 147.5, 142.2, 170.0, "=SUM(B10:M10)"]
- ["Southeast", 156.5, 126.7, 151.6, 169.4, 186.3, 202.1, 212.8, 174.9, 171.5, 184.8, 217.0, 258.4, "=SUM(B11:M11)"]
- ["Gulf Coast", 98.9, 97.5, 115.9, 106.3, 117.1, 127.2, 134.2, 133.9, 130.7, 116.0, 136.3, 162.6, "=SUM(B12:M12)"]
- ["Mid-Atlantic", 146.2, 144.5, 172.5, 192.3, 211.1, 188.1, 199.1, 199.1, 194.8, 209.6, 245.5, 240.9, "=SUM(B13:M13)"]
- ["New England", 91.7, 90.3, 88.7, 99.0, 108.8, 117.9, 124.2, 102.1, 100.1, 107.9, 126.4, 150.3, "=SUM(B14:M14)"]
- ["Total", "=SUM(B5:B14)", "=SUM(C5:C14)", "=SUM(D5:D14)", "=SUM(E5:E14)", "=SUM(F5:F14)", "=SUM(G5:G14)", "=SUM(H5:H14)", "=SUM(I5:I14)", "=SUM(J5:J14)", "=SUM(K5:K14)", "=SUM(L5:L14)", "=SUM(M5:M14)", "=SUM(N5:N14)"]
- { command: range.setValues, params: { range: A17, values: [["Best region", "=INDEX(A5:A14,MATCH(MAX(N5:N14),N5:N14,0))", null, null, null, "Peak month", null, "=INDEX(B4:M4,MATCH(MAX(B15:M15),B15:M15,0))"]] } }
- { command: home.fontSize, params: { range: A1, size: 20 } }
- { command: home.bold, params: { range: A1 } }
- { command: home.fontColor, params: { range: A1, color: "#7a2e1d" } }
- { command: home.italic, params: { range: A2 } }
- { command: home.fontColor, params: { range: A2, color: "#6b7280" } }
- { command: home.fillColor, params: { range: "A4:N4", color: "#3b2f2a" } }
- { command: home.fontColor, params: { range: "A4:N4", color: "#ffffff" } }
- { command: home.bold, params: { range: "A4:N4" } }
- { command: home.alignCenter, params: { range: "B4:N4" } }
- { command: home.numberFormat, params: { range: "B5:M15", format: "0" } }
- { command: home.numberFormat, params: { range: "N5:N15", format: "#,##0" } }
- { command: home.alignCenter, params: { range: "B5:M15" } }
- { command: home.conditionalFormat, params: { range: "B5:M14", rule: { type: colorScale, colors: ["#fdf6e3", "#f6c177", "#e0603f"] } } }
- { command: home.conditionalFormat, params: { range: "N5:N14", rule: { type: dataBar, color: "#c9a38f" } } }
- { command: home.conditionalFormat, params: { range: "N5:N14", rule: { type: iconSet, set: 3TrafficLights1 } } }
- { command: home.bold, params: { range: "A15:N15" } }
- { command: home.bold, params: { range: "N5:N14" } }
- { command: home.borders, params: { range: "A15:N15", preset: topDoubleBottom, color: "#3b2f2a" } }
- { command: home.borders, params: { range: "B5:M14", preset: all, color: "#ffffff" } }
- { command: home.mergeCells, params: { range: "B17:D17" } }
- { command: home.mergeCells, params: { range: "F17:G17" } }
- { command: home.mergeCells, params: { range: "H17:I17" } }
- { command: home.fillColor, params: { range: "A17:D17", color: "#f7ede8" } }
- { command: home.fillColor, params: { range: "F17:I17", color: "#f7ede8" } }
- { command: home.bold, params: { range: "B17" } }
- { command: home.bold, params: { range: "H17" } }
- { command: home.fontColor, params: { range: "A17", color: "#7a2e1d" } }
- { command: home.fontColor, params: { range: "F17", color: "#7a2e1d" } }
- { command: home.columnWidth, params: { cols: "A:A", width: 96 } }
- { command: home.columnWidth, params: { cols: "B:M", width: 44 } }
- { command: home.columnWidth, params: { cols: "N:N", width: 72 } }
- { command: home.rowHeight, params: { rows: "1:1", height: 28 } }
- { command: home.rowHeight, params: { rows: "4:15", height: 22 } }
- { command: home.alignMiddle, params: { range: "A4:N17" } }
- { command: sheet.read, params: { range: "N5:N15" }, as: years }
- { command: sheet.read, params: { range: "A17:H17" }, as: callouts }
- { command: sheet.read, params: { range: "L15:M15" }, as: peak }
- { command: document.inspect, params: {}, as: doc }Checks
8 checks on every buildresults.years.values.0.0= {"approx":1738.3,"tol":0.01}results.years.values.1.0= {"approx":2600.8,"tol":0.01}results.years.values.10.0= {"approx":17377.1,"tol":0.01}results.callouts.values.0= ["Best region","Pacific Coast",null,null,null,"Peak month",null,"Dec"]results.doc.sheets.0.conditionalFormats= 3results.peak.values.0= [{"approx":1678,"tol":0.01},{"approx":1911.1,"tol":0.01}]- Diagnostics: none, the kit's own check finds nothing wrong
- The saved document opens again, and its thumbnail matches
thumb.pngwithin the render tolerance
Related
More Sheet samples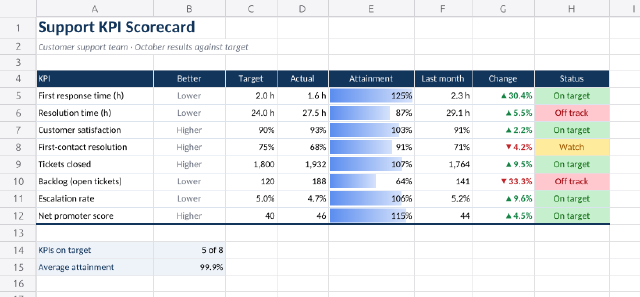
Support KPI Scorecard
A monthly customer-support scorecard with attainment data bars, coloured trend arrows and rule-driven status pills.
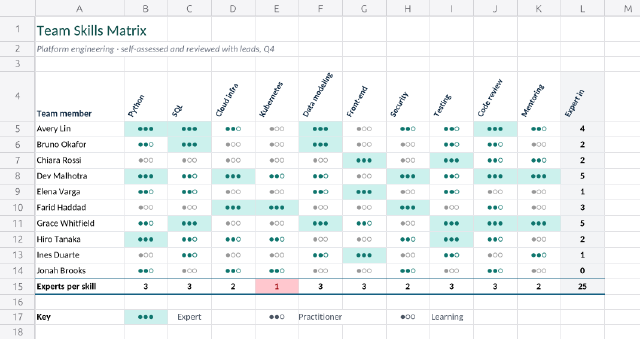
Team Skills Matrix
An engineering team's skills grid with angled column headers, dot ratings from a number format and named cell styles.
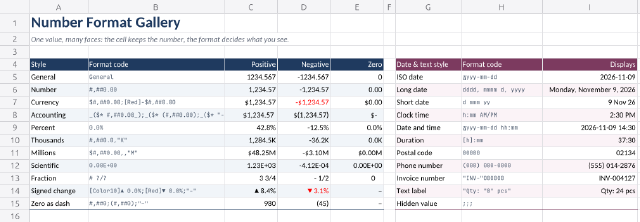
Number Format Gallery
A reference card that shows the same numbers, dates and codes through a dozen built-in and custom number formats.
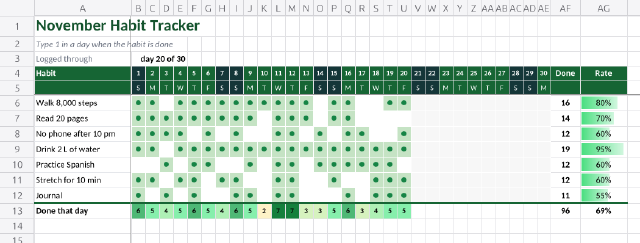
Monthly Habit Tracker
A November habit grid where a 1 becomes a dot through a number format, with completion rates, data bars and a daily heat row.