Break-Even Analysis
How many coffee drippers a small pottery has to sell each month to cover its costs, with the revenue and cost lines crossing on a chart.
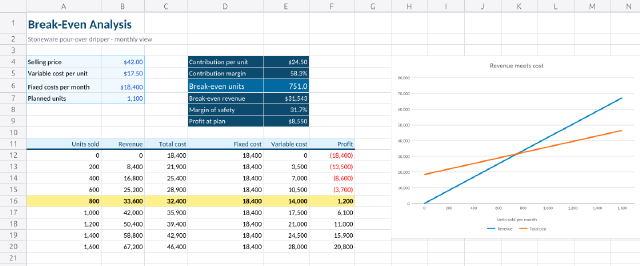
Price, unit cost, fixed costs and a planned volume give the contribution margin, the break-even volume and revenue, the margin of safety and the profit at plan. The volume table below steps from 0 to 1,600 units, losses show in red and the first profitable row is highlighted. The volumes are typed as text labels (a leading apostrophe) so the line chart takes them as its categories, while the formulas still multiply them as numbers; revenue and total cost cross at the break-even volume.
Steps
44 commandssteps:
- { command: range.setValues, params: { range: A1, values: [["Break-Even Analysis"], ["Stoneware pour-over dripper · monthly view"]] } }
- command: range.setValues
params:
range: A4
values:
- [Selling price, 42, null, Contribution per unit, "=B4-B5"]
- [Variable cost per unit, 17.5, null, Contribution margin, "=E4/B4"]
- [Fixed costs per month, 18400, null, Break-even units, "=B6/E4"]
- [Planned units, 1100, null, Break-even revenue, "=E6*B4"]
- [null, null, null, Margin of safety, "=(B7-E6)/B7"]
- [null, null, null, Profit at plan, "=B7*E4-B6"]
- command: range.setValues
params:
range: A11
values:
- [Units sold, Revenue, Total cost, Fixed cost, Variable cost, Profit]
- ["'0", "=A12*$B$4", "=D12+E12", "=$B$6", "=A12*$B$5", "=B12-C12"]
- ["'200", "=A13*$B$4", "=D13+E13", "=$B$6", "=A13*$B$5", "=B13-C13"]
- ["'400", "=A14*$B$4", "=D14+E14", "=$B$6", "=A14*$B$5", "=B14-C14"]
- ["'600", "=A15*$B$4", "=D15+E15", "=$B$6", "=A15*$B$5", "=B15-C15"]
- ["'800", "=A16*$B$4", "=D16+E16", "=$B$6", "=A16*$B$5", "=B16-C16"]
- ["'1,000", "=A17*$B$4", "=D17+E17", "=$B$6", "=A17*$B$5", "=B17-C17"]
- ["'1,200", "=A18*$B$4", "=D18+E18", "=$B$6", "=A18*$B$5", "=B18-C18"]
- ["'1,400", "=A19*$B$4", "=D19+E19", "=$B$6", "=A19*$B$5", "=B19-C19"]
- ["'1,600", "=A20*$B$4", "=D20+E20", "=$B$6", "=A20*$B$5", "=B20-C20"]
- { command: home.fontSize, params: { range: A1, size: 20 } }
- { command: home.bold, params: { range: A1 } }
- { command: home.fontColor, params: { range: A1, color: "#0c4a6e" } }
- { command: home.fontColor, params: { range: A2, color: "#6b7280" } }
- { command: home.fontColor, params: { range: "B4:B7", color: "#1d4ed8" } }
- { command: home.fillColor, params: { range: "A4:B7", color: "#f0f9ff" } }
- { command: home.borders, params: { range: "A4:B7", preset: outside, color: "#7dd3fc" } }
- { command: home.numberFormat, params: { range: "B4:B5", format: "$$#,##0.00" } }
- { command: home.numberFormat, params: { range: "B6", format: "$$#,##0" } }
- { command: home.numberFormat, params: { range: "B7", format: "#,##0" } }
- { command: home.fillColor, params: { range: "D4:E9", color: "#0c4a6e" } }
- { command: home.fontColor, params: { range: "D4:E9", color: "#ffffff" } }
- { command: home.bold, params: { range: "E4:E9" } }
- { command: home.numberFormat, params: { range: "E4", format: "$$#,##0.00" } }
- { command: home.numberFormat, params: { range: "E5", format: "0.0%" } }
- { command: home.numberFormat, params: { range: "E6", format: "#,##0.0" } }
- { command: home.numberFormat, params: { range: "E7", format: "$$#,##0" } }
- { command: home.numberFormat, params: { range: "E8", format: "0.0%" } }
- { command: home.numberFormat, params: { range: "E9", format: "$$#,##0" } }
- { command: home.fillColor, params: { range: "D6:E6", color: "#0369a1" } }
- { command: home.fontSize, params: { range: "D6:E6", size: 13 } }
- { command: home.bold, params: { range: "A11:F11" } }
- { command: home.fillColor, params: { range: "A11:F11", color: "#e0f2fe" } }
- { command: home.fontColor, params: { range: "A11:F11", color: "#0c4a6e" } }
- { command: home.borders, params: { range: "A11:F11", preset: bottom, style: medium, color: "#0c4a6e" } }
- { command: home.alignRight, params: { range: "A11:F11" } }
- { command: home.alignRight, params: { range: "A12:A20" } }
- { command: home.numberFormat, params: { range: "B12:F20", format: "#,##0;[Red](#,##0)" } }
- { command: home.borders, params: { range: "A12:F20", preset: insideHorizontal, color: "#e5e7eb" } }
- { command: home.conditionalFormat, params: { range: "A12:F20", rule: { type: expression, formula: "=AND($F12>=0,$F11<0)", style: { font: { bold: true }, fill: { fg: { Rgb: 16707722 }, pattern: Solid } } } } }
- { command: home.columnWidth, params: { cols: "A:A", width: 130 } }
- { command: home.columnWidth, params: { cols: "B:C", width: 76 } }
- { command: home.columnWidth, params: { cols: "D:D", width: 132 } }
- { command: home.columnWidth, params: { cols: "E:F", width: 80 } }
- { command: insert.chart, params: { range: "A11:C20", type: line }, as: chart }
- { command: chart.set, params: { title: Revenue meets cost, legend: bottom, xTitle: Units sold per month, at: H4, width: 440, height: 320 } }
- { command: chart.formatSelection, params: { series: 0, color: "#0284c7" } }
- { command: chart.formatSelection, params: { series: 1, color: "#f97316" } }
- { command: sheet.read, params: { range: "E4:E9" }, as: results }
- { command: sheet.read, params: { range: "A16:F16" }, as: row800 }
- { command: sheet.read, params: { range: "B20:F20" }, as: row1600 }Checks
5 checks on every buildresults.results.values= [[24.5],[{"approx":0.5833333,"tol":0.000001}],[{"approx":751.0204082,"tol":0.000001}],[{"approx":31542.8571429,"tol":0.000001}],[{"approx":0.3172542,"tol":0.…results.row1600.values.0= [67200,46400,18400,28000,20800]results.row800.values.0= ["800",33600,32400,18400,14000,1200]- Diagnostics: none, the kit's own check finds nothing wrong
- The saved document opens again, and its thumbnail matches
thumb.pngwithin the render tolerance
Related
More Sheet samples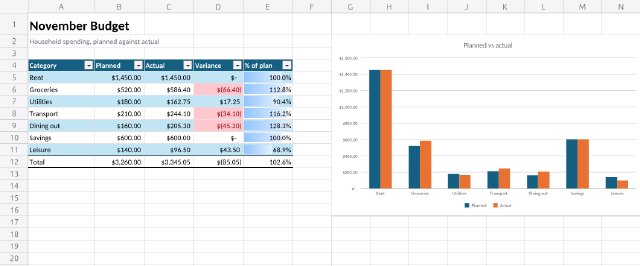
Household Budget
A monthly budget with planned and actual spending, variance formulas, a total row and a column chart.
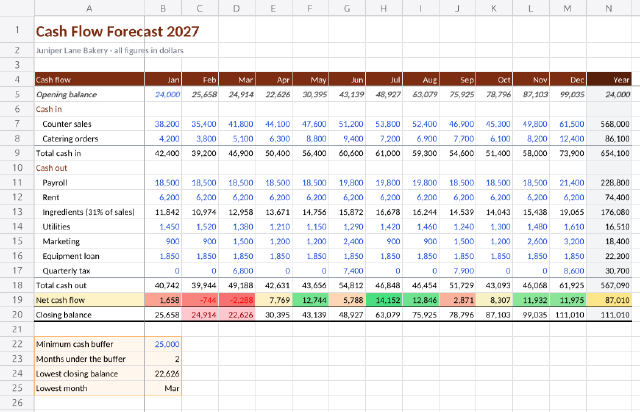
12-Month Cash Flow Forecast
A bakery's year of cash in and cash out, month by month, with running balances, a colour scale and a warning when cash dips under the buffer.
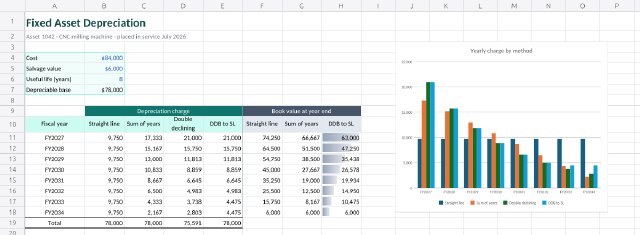
Depreciation Schedule
One machine depreciated four ways, with SLN, SYD, DDB and VDB side by side and the book value each leaves behind.
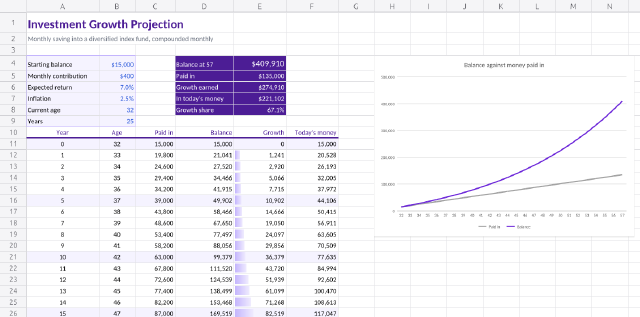
Investment Growth Projection
Twenty-five years of monthly saving projected with FV, split into money paid in and growth earned, with a line chart of the gap opening up.