Exam Score Statistics
A class's test scores described with AVERAGE, MEDIAN, MODE, STDEV, QUARTILE and PERCENTILE, binned with FREQUENCY into a histogram.
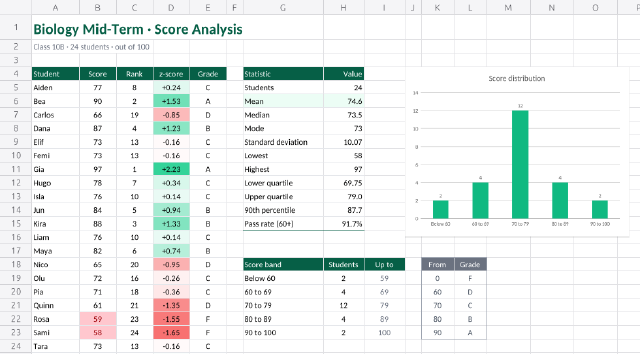
Twenty-four scores from a biology mid-term. Each student gets a rank (RANK.EQ), a z-score (STANDARDIZE against the class mean and standard deviation) and a letter grade looked up with XLOOKUP in next-smaller mode. The panel on the right is the usual descriptive set: count, mean, median, mode, sample standard deviation, range, quartiles, the 90th percentile and the pass rate. FREQUENCY bins the scores in one spilling formula (DROP removes its overflow bin), and the column chart of the bins is the histogram.
Steps
52 commandssteps:
- { command: range.setValues, params: { range: A1, values: [["Biology Mid-Term · Score Analysis"], ["Class 10B · 24 students · out of 100"]] } }
- command: range.setValues
params:
range: A4
values:
- [Student, Score, Rank, z-score, Grade]
- [Aiden, 77, "=RANK.EQ(B5,$B$5:$B$28)", "=STANDARDIZE(B5,$H$6,$H$9)", "=XLOOKUP(B5,$K$19:$K$23,$L$19:$L$23,,-1)"]
- [Bea, 90]
- [Carlos, 66]
- [Dana, 87]
- [Elif, 73]
- [Femi, 73]
- [Gia, 97]
- [Hugo, 78]
- [Isla, 76]
- [Jun, 84]
- [Kira, 88]
- [Liam, 76]
- [Maya, 82]
- [Nico, 65]
- [Olu, 72]
- [Pia, 71]
- [Quinn, 61]
- [Rosa, 59]
- [Sami, 58]
- [Tara, 73]
- [Uma, 74]
- [Vik, 72]
- [Wren, 77]
- [Yara, 61]
- { command: edit.fillDown, params: { range: "C5:E28" } }
- command: range.setValues
params:
range: G4
values:
- [Statistic, Value]
- [Students, "=COUNT(B5:B28)"]
- [Mean, "=AVERAGE(B5:B28)"]
- [Median, "=MEDIAN(B5:B28)"]
- [Mode, "=MODE.SNGL(B5:B28)"]
- [Standard deviation, "=STDEV.S(B5:B28)"]
- [Lowest, "=MIN(B5:B28)"]
- [Highest, "=MAX(B5:B28)"]
- [Lower quartile, "=QUARTILE.INC(B5:B28,1)"]
- [Upper quartile, "=QUARTILE.INC(B5:B28,3)"]
- [90th percentile, "=PERCENTILE.INC(B5:B28,0.9)"]
- [Pass rate (60+), "=COUNTIF(B5:B28,\">=60\")/H5"]
- command: range.setValues
params:
range: G18
values:
- [Score band, Students, Up to]
- [Below 60, "=DROP(FREQUENCY(B5:B28,I19:I23),-1)", 59]
- [60 to 69, null, 69]
- [70 to 79, null, 79]
- [80 to 89, null, 89]
- [90 to 100, null, 100]
- command: range.setValues
params:
range: K18
values:
- [From, Grade]
- [0, F]
- [60, D]
- [70, C]
- [80, B]
- [90, A]
- { command: home.fontSize, params: { range: A1, size: 20 } }
- { command: home.bold, params: { range: A1 } }
- { command: home.fontColor, params: { range: A1, color: "#065f46" } }
- { command: home.fontColor, params: { range: A2, color: "#6b7280" } }
- { command: home.fillColor, params: { range: "A4:E4", color: "#065f46" } }
- { command: home.fillColor, params: { range: "G4:H4", color: "#065f46" } }
- { command: home.fillColor, params: { range: "G18:I18", color: "#065f46" } }
- { command: home.fillColor, params: { range: "K18:L18", color: "#6b7280" } }
- { command: home.fontColor, params: { range: "A4:L4", color: "#ffffff" } }
- { command: home.fontColor, params: { range: "G18:L18", color: "#ffffff" } }
- { command: home.bold, params: { range: "A4:L4" } }
- { command: home.bold, params: { range: "G18:L18" } }
- { command: home.alignCenter, params: { range: "B4:E28" } }
- { command: home.alignRight, params: { range: "H4" } }
- { command: home.numberFormat, params: { range: "D5:D28", format: "+0.00;-0.00;0.00" } }
- { command: home.bold, params: { range: "E5:E28" } }
- { command: home.borders, params: { range: "A5:E28", preset: insideHorizontal, color: "#e5e7eb" } }
- { command: home.conditionalFormat, params: { range: "D5:D28", rule: { type: colorScale, colors: ["#f87171", "#ffffff", "#34d399"] } } }
- { command: home.conditionalFormat, params: { range: "B5:B28", rule: { type: expression, formula: "=B5<60", preset: lightRedFillDarkRedText } } }
- { command: home.numberFormat, params: { range: "H6:H7", format: "0.0" } }
- { command: home.numberFormat, params: { range: "H9", format: "0.00" } }
- { command: home.numberFormat, params: { range: "H12:H14", format: "0.0#" } }
- { command: home.numberFormat, params: { range: "H15", format: "0.0%" } }
- { command: home.borders, params: { range: "G5:H15", preset: insideHorizontal, color: "#e5e7eb" } }
- { command: home.borders, params: { range: "G15:H15", preset: bottom, color: "#065f46" } }
- { command: home.fillColor, params: { range: "G6:H6", color: "#ecfdf5" } }
- { command: home.bold, params: { range: "G6:H6" } }
- { command: home.alignCenter, params: { range: "H18:I23" } }
- { command: home.fontColor, params: { range: "I19:I23", color: "#6b7280" } }
- { command: home.alignCenter, params: { range: "K18:L23" } }
- { command: home.fontColor, params: { range: "K19:L23", color: "#4b5563" } }
- { command: home.borders, params: { range: "G19:I23", preset: insideHorizontal, color: "#e5e7eb" } }
- { command: home.borders, params: { range: "K18:L23", preset: outside, color: "#9ca3af" } }
- { command: home.columnWidth, params: { cols: "A:A", width: 70 } }
- { command: home.columnWidth, params: { cols: "B:E", width: 54 } }
- { command: home.columnWidth, params: { cols: "F:F", width: 24 } }
- { command: home.columnWidth, params: { cols: "G:G", width: 118 } }
- { command: home.columnWidth, params: { cols: "H:I", width: 60 } }
- { command: home.columnWidth, params: { cols: "J:J", width: 24 } }
- { command: home.columnWidth, params: { cols: "K:L", width: 48 } }
- { command: insert.chart, params: { range: "G18:H23", type: column }, as: chart }
- { command: chart.set, params: { title: Score distribution, legend: none, dataLabels: true, at: J4, width: 330, height: 250 } }
- { command: chart.formatSelection, params: { series: 0, color: "#10b981" } }
- { command: sheet.read, params: { range: "A5:E10" }, as: roster }
- { command: sheet.read, params: { range: "H5:H15" }, as: stats }
- { command: sheet.read, params: { range: "H19:H24" }, as: bins }Checks
5 checks on every buildresults.roster.values= [["Aiden",77,8,{"approx":0.2400114,"tol":0.000001},"C"],["Bea",90,2,{"approx":1.5311074,"tol":0.000001},"A"],["Carlos",66,19,{"approx":-0.8524544,"tol":0.000…results.stats.values= [[24],[{"approx":74.5833333,"tol":0.000001}],[73.5],[73],[{"approx":10.0689651,"tol":0.000001}],[58],[97],[69.75],[79],[{"approx":87.7,"tol":0.000001}],[{"ap…results.bins.values= [[2],[4],[12],[4],[2],[null]]- Diagnostics: none, the kit's own check finds nothing wrong
- The saved document opens again, and its thumbnail matches
thumb.pngwithin the render tolerance
Related
More Sheet samples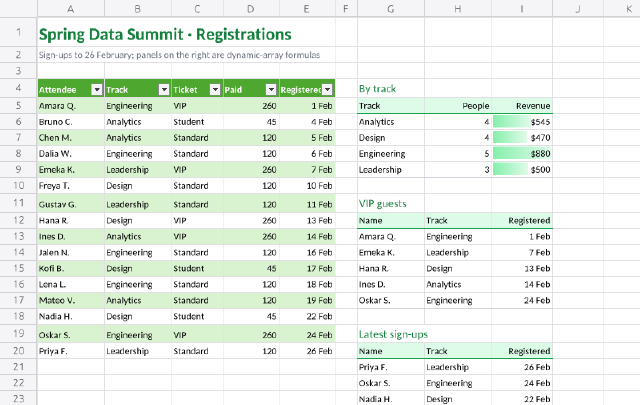
Dynamic Array Event Report
Three spilling summaries of a conference sign-up list, built with UNIQUE, SORT, FILTER, SORTBY, CHOOSECOLS and TAKE.
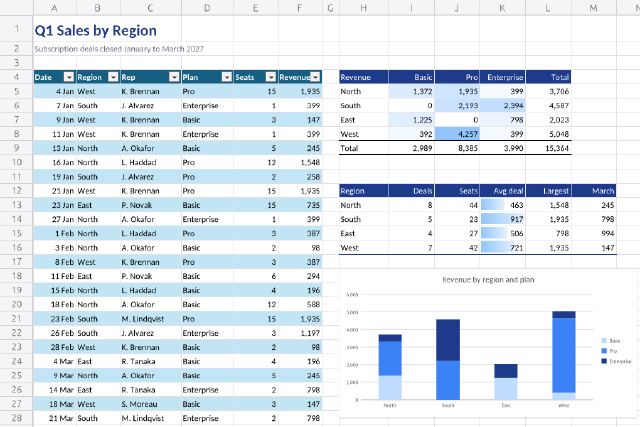
SUMIFS Regional Sales Summary
A quarter's deal log rolled up by region and product with SUMIFS, COUNTIFS, AVERAGEIFS and MAXIFS.
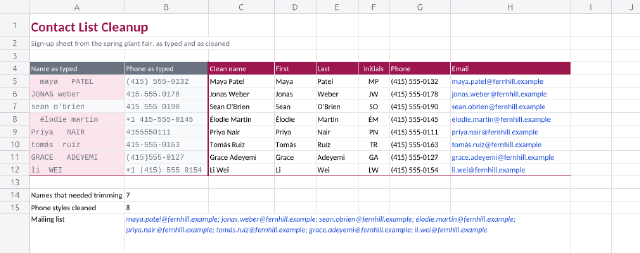
Text Cleanup with Functions
A messy contact import tidied with TRIM, PROPER, TEXTBEFORE, TEXTAFTER, TEXTJOIN and a LET formula that rebuilds every phone number.
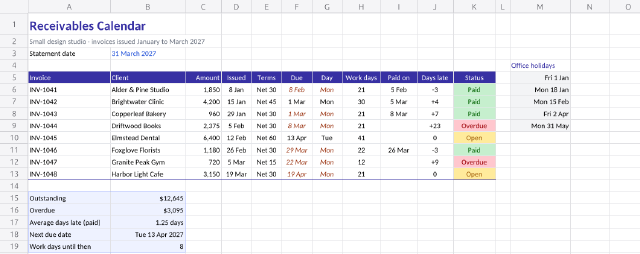
Invoice Due-Date Tracker
Due dates that skip weekends and office holidays with WORKDAY, business days with NETWORKDAYS, and a status for every invoice.