
Business Analytics Dashboard Table Template
Review revenue, cost, gross margin, cash collected, open receivables, ownership, and period movement in a compact table.
Business Analytics Dashboard Table Template
Real fields and representative values
| Period | Revenue | Cost | Gross margin | Receivables |
|---|---|---|---|---|
| 2026 Q1 | $480,000 | $292,000 | 39.2% | $29,000 |
| 2026 Q2 | $552,000 | $318,000 | 42.4% | $33,000 |
Best for
Founders, finance leads, operators, and small management teams preparing recurring business reviews.
Use it when
You need a small, explicit source table for management metrics before writing the narrative review.
Choose another system when
Do not treat sample calculations as audited financial statements or connect unverified figures to external reporting.
A visible structure you can inspect.
These are the real fields, nodes, or visual elements that make the template useful. Rename them when your process differs; do not preserve a field only because it was bundled.
01
Period — defines the reporting window.
02
Revenue, Cost, and Gross margin — keep headline performance explicit.
03
Cash collected and Open receivables — separate sales from cash movement.
04
Owner — identifies the accountable reviewer.
From starter to reviewed workspace
- 1
Define the reporting period convention.
- 2
Replace sample figures with values from an approved source.
- 3
Keep revenue, cash collected, and receivables separate.
- 4
Check gross margin calculation and unit consistency.
- 5
Use the table as evidence for a QBR or management report.
Product evidence
What is already real
- The starter includes 3 period records and 7 typed fields.
- Revenue and cash collected are intentionally separate.
- The Q1 and Q2 samples show a visible margin change.
Limits
What this template does not promise
- The starter does not import from accounting systems.
- Gross margin must be verified against the organization’s definition.
- The table is a management review surface, not an audit trail.
Completed artifact
Three-Quarter Business Metrics Example
See a compact management dataset that keeps revenue, cost, margin, collections, receivables, and ownership ready for review.
More table templates
Table template
Task Tracker Table Template
Track delivery work with owners, progress, dates, priority flags, status updates, and notes in one editable Kition table.
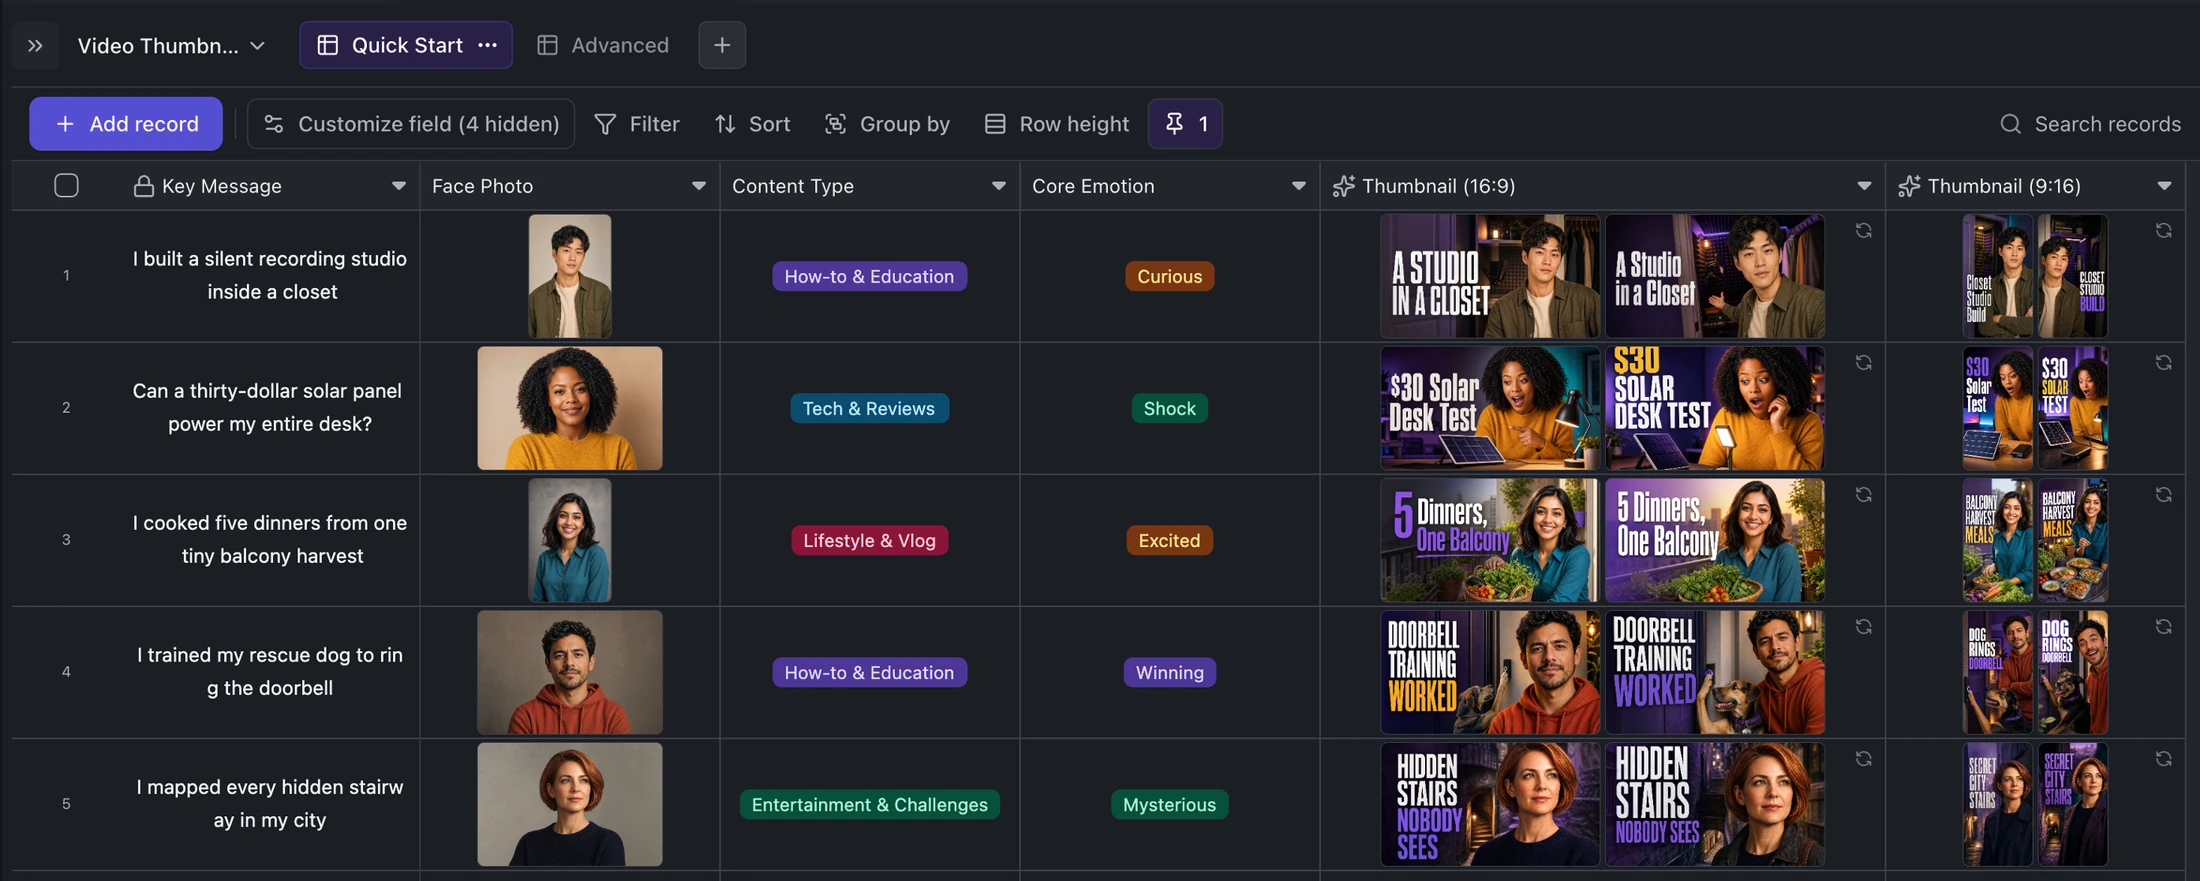
Table template
YouTube and TikTok Thumbnail Generator Template
Turn one content idea and portrait into concise titles plus two original landscape and two vertical thumbnail variants per record.
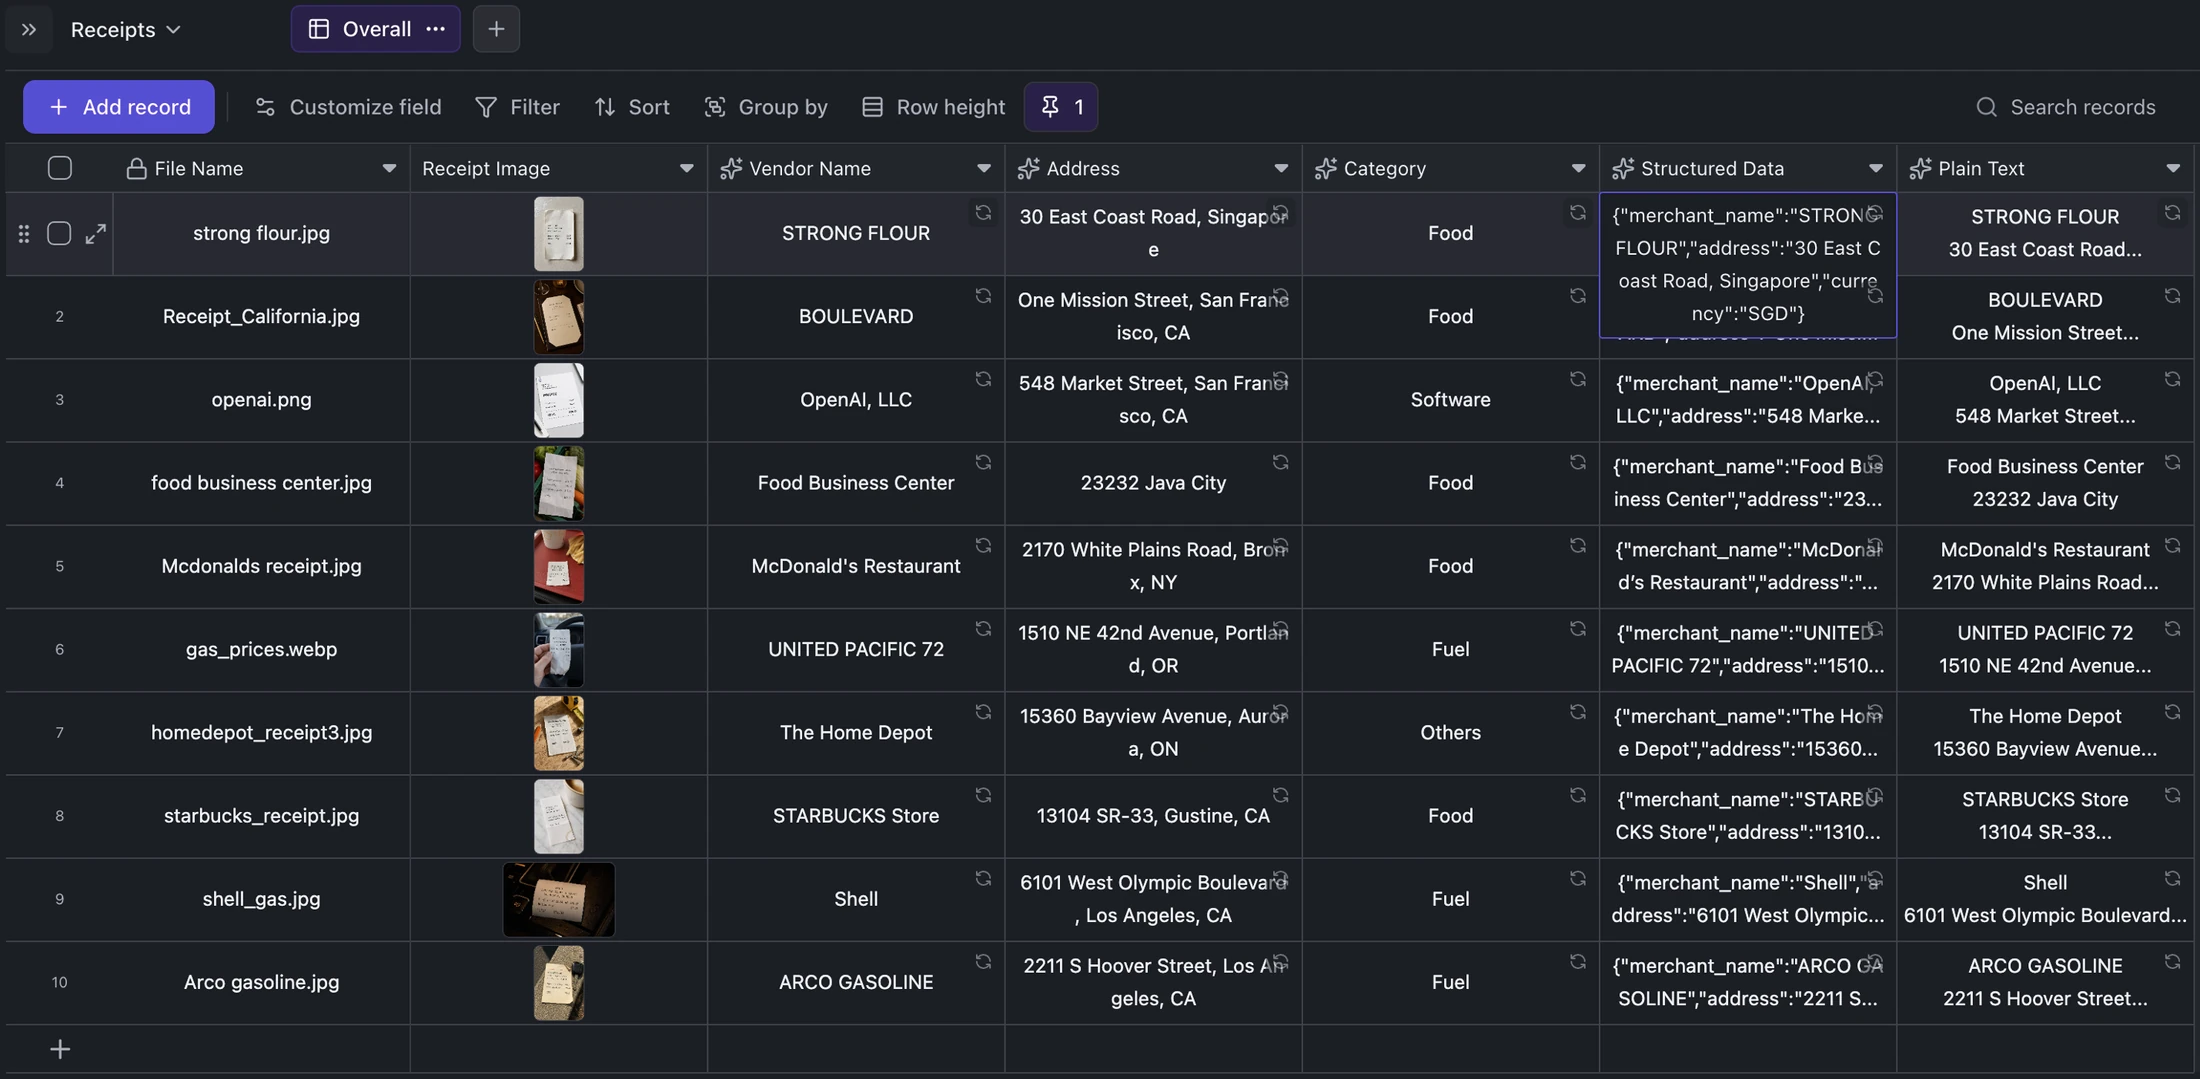
Table template
Receipt OCR Table Template
Keep receipt images beside extracted vendor, address, category, structured JSON, and plain OCR text for correction and export.
Ready when you are.
Kition is a desktop AI workspace for connected documents, structured tables, editable designs, whiteboards, visual workflows, and reviewable AI agents.