
Three-Quarter Business Metrics Example
See a compact management dataset that keeps revenue, cost, margin, collections, receivables, and ownership ready for review.
Three-Quarter Business Metrics Example
Real fields and representative values
| Period | Revenue | Cost | Gross margin | Receivables |
|---|---|---|---|---|
| 2026 Q1 | $480,000 | $292,000 | 39.2% | $29,000 |
| 2026 Q2 | $552,000 | $318,000 | 42.4% | $33,000 |
Scenario
The specific job behind this example
A founder is preparing a quarterly review and wants the narrative to remain connected to a small, inspectable source table.
Input
What the work started with
- Approved quarterly revenue, cost, cash, and receivable figures.
- A consistent gross-margin definition.
- A named finance owner.
Output
What the completed workspace contains
- A three-period metrics table.
- Visible period-over-period changes.
- A structured source for the management narrative.
The result is complete only after these checks.
A generated field, copied record, or finished diagram is not automatically correct. These checks define the minimum acceptance boundary for this example.
Validation checklist
- Currency and period units are consistent.
- Gross margin is independently checked.
- Narrative claims link back to the correct period values.
Reproduce the result
Business Analytics Dashboard Table Template
Inspect the starter structure, known limitations, product source, and setup steps before adapting this completed example to your own project.
More examples from this Kition surface
Table example
Completed Product Discovery Task Tracker Example
See how a 20-row product discovery backlog records ownership, expected delivery, actual completion, and the latest evidence.
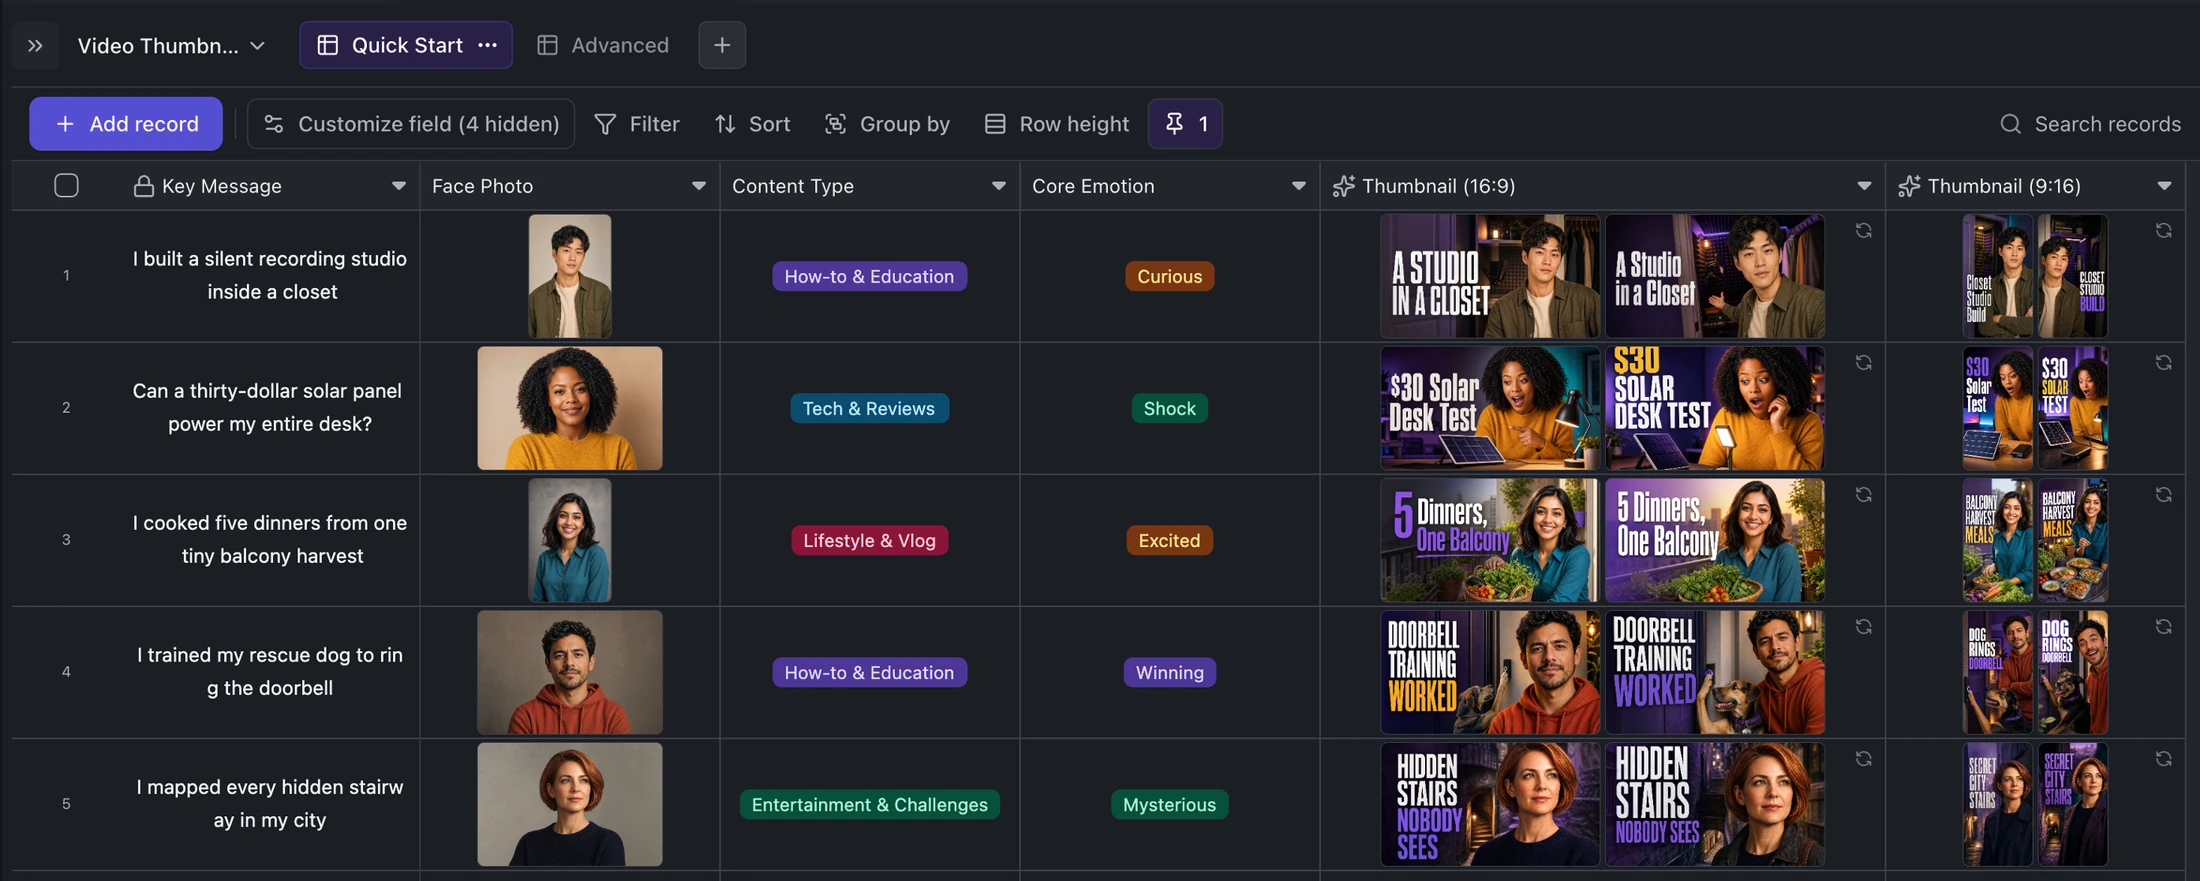
Table example
Five-Video Thumbnail Production Example
Inspect a finished thumbnail queue with five source ideas, format-specific titles, portraits, and 25 generated assets.
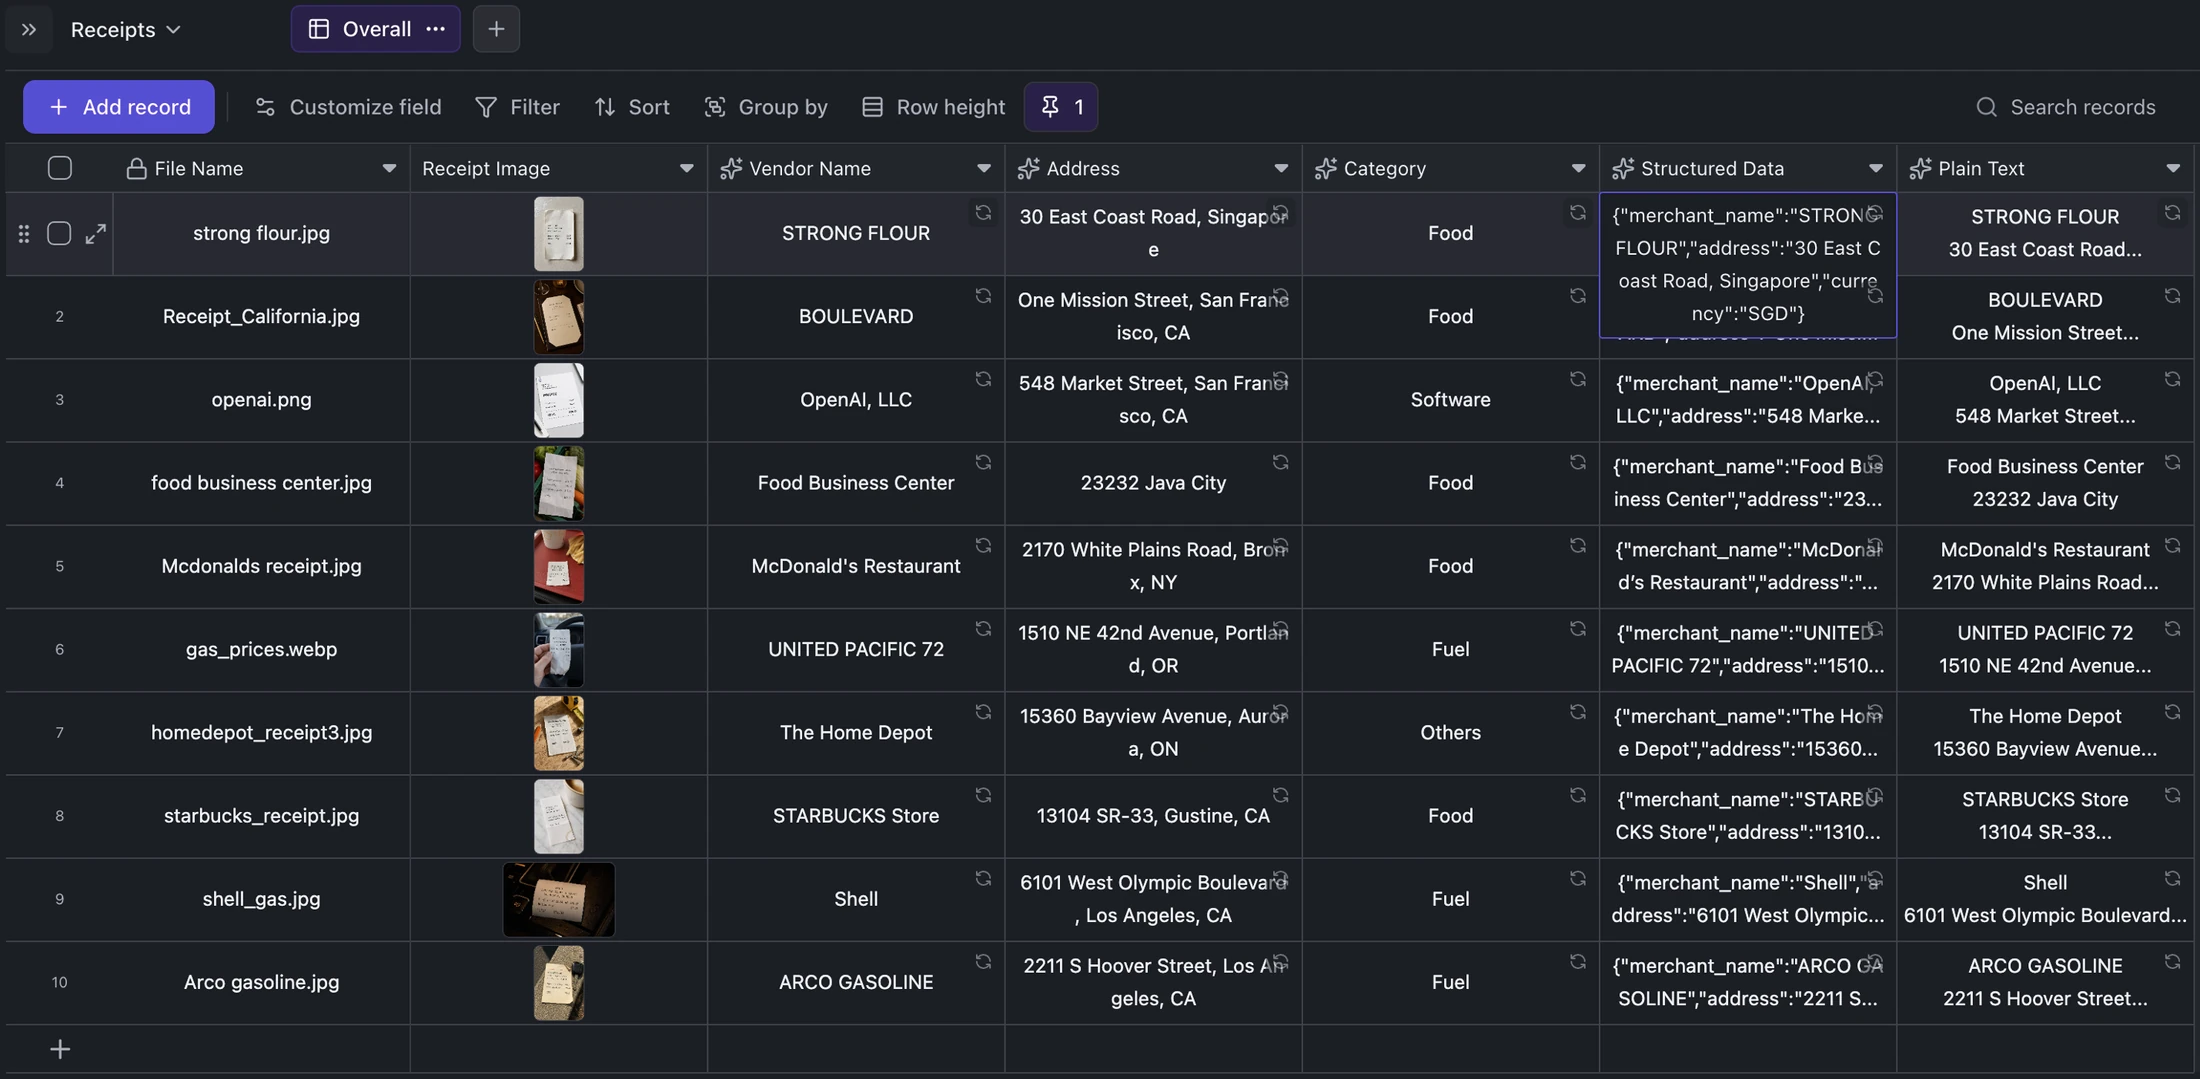
Table example
Ten-Receipt OCR Review Example
Review a completed ten-record receipt archive where each source image remains attached to structured and plain-text extraction.
Ready when you are.
Kition is a desktop AI workspace for connected documents, structured tables, editable designs, whiteboards, visual workflows, and reviewable AI agents.