Revenue Mix Stacked Columns
Six quarters of revenue stacked by product line in one colour family, with a headline that states the shift and three numbered takeaways.
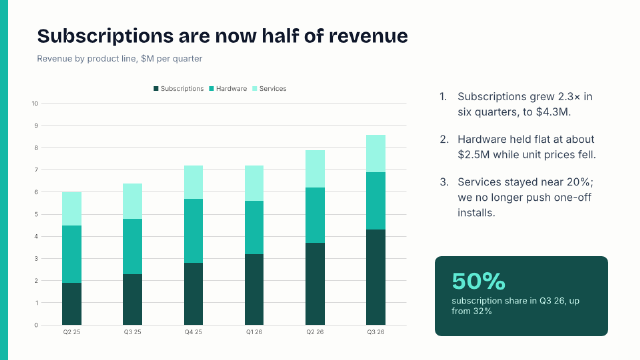
A stacked column chart whose series take three shades of teal from the deck's colour scheme, so the stack reads as one total split into parts. The legend sits on top, gridlines stay light, and a numbered list beside the chart explains the mix shift the headline announces.
Steps
37 commandssteps:
- { command: design.colors, params: { colors: { accent1: "#134e4a", accent2: "#14b8a6", accent3: "#99f6e4" } } }
- { command: design.fonts, params: { major: Bricolage Grotesque, minor: Inter } }
- { command: slide.layout, params: { layout: blank, index: 0 } }
- { command: design.background, params: { color: "#fdfdfb" } }
- { command: shape.insert, params: { preset: rect, rect: [0, 0, 12, 540] }, as: edge }
- { command: shape.fill, params: { ids: [$edge.id], color: "#14b8a6" } }
- { command: shape.line, params: { ids: [$edge.id], none: true } }
- { command: insert.textBox, params: { rect: [48, 32, 860, 46], text: Subscriptions are now half of revenue }, as: title }
- { command: format.font, params: { ids: [$title.id], family: Bricolage Grotesque } }
- { command: format.size, params: { ids: [$title.id], size: 30 } }
- { command: format.bold, params: { ids: [$title.id] } }
- { command: format.color, params: { ids: [$title.id], color: "#0f172a" } }
- { command: insert.textBox, params: { rect: [48, 76, 860, 24], text: "Revenue by product line, $M per quarter" }, as: lede }
- { command: format.size, params: { ids: [$lede.id], size: 13 } }
- { command: format.color, params: { ids: [$lede.id], color: "#64748b" } }
- command: insert.chart
params:
type: stackedColumn
rect: [40, 116, 580, 396]
categories: [Q2 25, Q3 25, Q4 25, Q1 26, Q2 26, Q3 26]
series:
- { name: Subscriptions, values: [1.9, 2.3, 2.8, 3.2, 3.7, 4.3] }
- { name: Hardware, values: [2.6, 2.5, 2.9, 2.4, 2.5, 2.6] }
- { name: Services, values: [1.5, 1.6, 1.5, 1.6, 1.7, 1.7] }
as: chart
- { command: chart.options, params: { id: $chart.id, title: null, legend: t, dataLabels: false, gridlines: true } }
- { command: insert.textBox, params: { rect: [652, 128, 260, 360], text: "Subscriptions grew 2.3× in six quarters, to $4.3M.\nHardware held flat at about $2.5M while unit prices fell.\nServices stayed near 20%; we no longer push one-off installs." }, as: points }
- { command: format.numbering, params: { ids: [$points.id], scheme: arabicPeriod } }
- { command: format.size, params: { ids: [$points.id], size: 16 } }
- { command: format.color, params: { ids: [$points.id], color: "#334155" } }
- { command: format.paragraph, params: { ids: [$points.id], spaceAfter: 18, lineSpacing: 1.2 } }
- { command: shape.insert, params: { preset: roundRect, rect: [652, 384, 260, 120], adj: [8000] }, as: card }
- { command: shape.fill, params: { ids: [$card.id], color: "#134e4a" } }
- { command: shape.line, params: { ids: [$card.id], none: true } }
- { command: insert.textBox, params: { rect: [670, 396, 230, 96], text: "50%\nsubscription share in Q3 26, up from 32%" }, as: kpi }
- { command: format.size, params: { ids: [$kpi.id], size: 13 } }
- { command: format.color, params: { ids: [$kpi.id], color: "#ccfbf1" } }
- { command: text.edit, params: { id: $kpi.id, at: [0, 0] } }
- { command: text.selectParagraph, params: { at: [0, 0] } }
- { command: format.size, params: { size: 36 } }
- { command: format.bold, params: {} }
- { command: format.font, params: { family: Bricolage Grotesque } }
- { command: format.color, params: { color: "#5eead4" } }
- { command: text.exit, params: {} }
- { command: shape.inspect, params: { id: $chart.id }, as: c }
- { command: slide.inspect, params: { index: 0 }, as: slide }Checks
5 checks on every buildinspect.slides= {"count":1}results.c.shape.kind= {"kind":"stackedColumn","legend":"t","title":null,"series":{"count":3}}results.slide.design= {"none":{"code":"design.low-contrast"}}- Diagnostics: none, the kit's own check finds nothing wrong
- The saved document opens again, and its thumbnail matches
thumb.pngwithin the render tolerance
Related
More Slide samples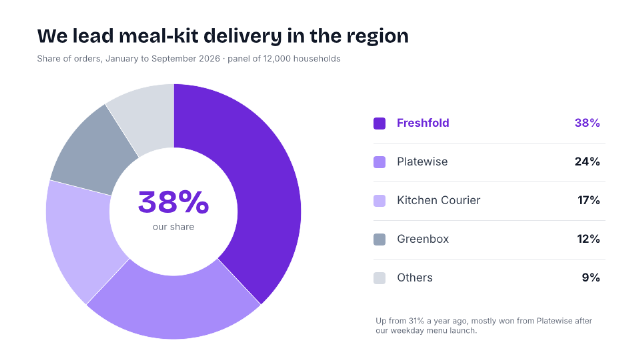
Market Share Doughnut
A doughnut chart of market share with the company's own slice in a strong colour, its share set large in the hole, and a hand-built legend with values.
Survey Results Likert Bars
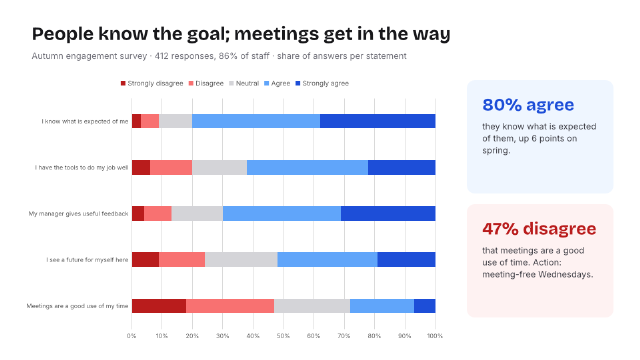
An employee survey shown as 100% stacked bars, five answers per statement in a red-to-blue diverging palette taken from the theme.
KPI Dashboard with Sparklines
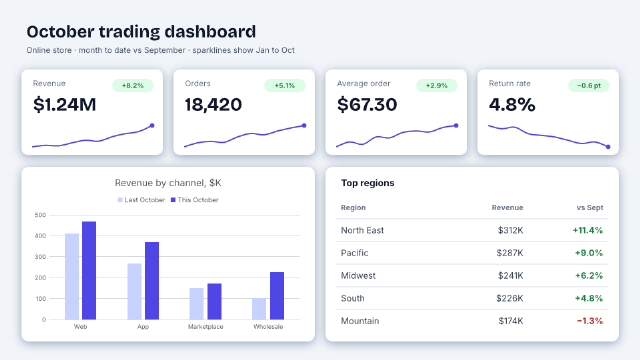
A monthly e-commerce dashboard with four KPI tiles carrying freeform sparklines and change pills, a channel column chart and a regional table.
Budget vs Actual Table
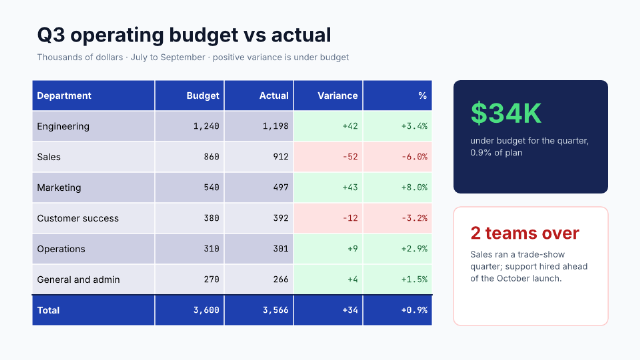
A quarterly operating budget table with right-aligned monospaced figures, green and red variance cells, a bold total row and two callout cards.