Quarterly Business Review
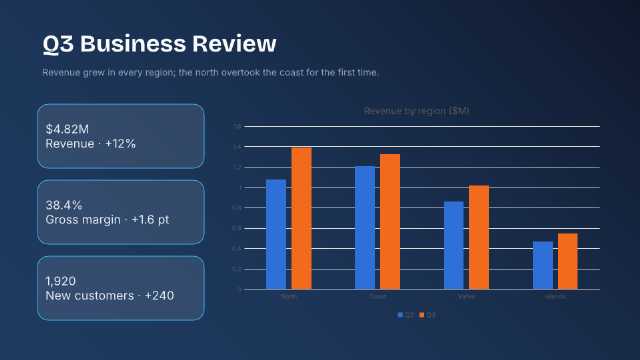
A results slide with a gradient background, three KPI cards and a clustered column chart of revenue by region.
Steps
20 commandssteps:
- { command: design.fonts, params: { major: Bricolage Grotesque, minor: Inter } }
- { command: slide.layout, params: { layout: blank, index: 0 } }
- { command: design.background, params: { gradient: { stops: [[0, "#0f172a"], [1, "#1e3a5f"]], angle: 135 } } }
- { command: insert.textBox, params: { rect: [56, 40, 620, 60], text: Q3 Business Review }, as: title }
- { command: format.font, params: { ids: [$title.id], family: Bricolage Grotesque } }
- { command: format.size, params: { ids: [$title.id], size: 36 } }
- { command: format.bold, params: { ids: [$title.id] } }
- { command: format.color, params: { ids: [$title.id], color: "#f8fafc" } }
- { command: insert.textBox, params: { rect: [56, 96, 620, 30], text: "Revenue grew in every region; the north overtook the coast for the first time." }, as: lede }
- { command: format.size, params: { ids: [$lede.id], size: 14 } }
- { command: format.color, params: { ids: [$lede.id], color: "#94a3b8" } }
- { command: shape.insert, params: { preset: roundRect, rect: [56, 156, 250, 96], text: "$$4.82M\nRevenue · +12%" }, as: kpi1 }
- { command: shape.insert, params: { preset: roundRect, rect: [56, 270, 250, 96], text: "38.4%\nGross margin · +1.6 pt" }, as: kpi2 }
- { command: shape.insert, params: { preset: roundRect, rect: [56, 384, 250, 96], text: "1,920\nNew customers · +240" }, as: kpi3 }
- { command: shape.fill, params: { ids: [$kpi1.id, $kpi2.id, $kpi3.id], color: "#f8fafc", transparency: 0.9 } }
- { command: shape.line, params: { ids: [$kpi1.id, $kpi2.id, $kpi3.id], color: "#38bdf8", width: 1 } }
- { command: format.color, params: { ids: [$kpi1.id, $kpi2.id, $kpi3.id], color: "#e2e8f0" } }
- { command: format.align, params: { ids: [$kpi1.id, $kpi2.id, $kpi3.id], align: left } }
- command: insert.chart
params:
type: column
rect: [340, 150, 570, 340]
categories: [North, Coast, Valley, Islands]
series:
- { name: Q2, values: [1.08, 1.21, 0.86, 0.47] }
- { name: Q3, values: [1.39, 1.33, 1.02, 0.55] }
title: Revenue by region ($M)
as: chart
- { command: chart.options, params: { id: $chart.id, legend: b, dataLabels: false, gridlines: true } }Checks
4 checks on every buildinspect.slides= {"count":1}inspect.slideSize= {"width":960,"height":540}- Diagnostics: none, the kit's own check finds nothing wrong
- The saved document opens again, and its thumbnail matches
thumb.pngwithin the render tolerance
Related
More Slide samples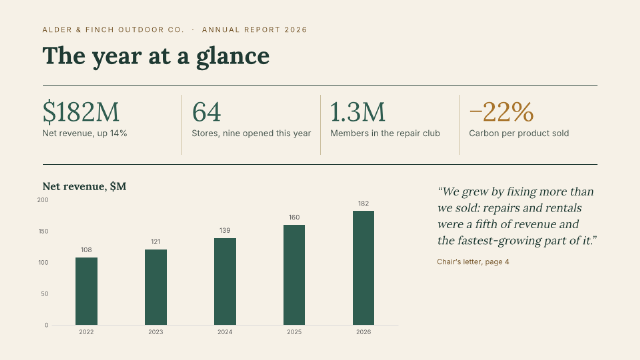
Annual Report Highlights
A "year at a glance" spread in a serif face, with four headline figures between hairline rules and a five-year revenue column chart.
1 slide; 960 × 540 pt
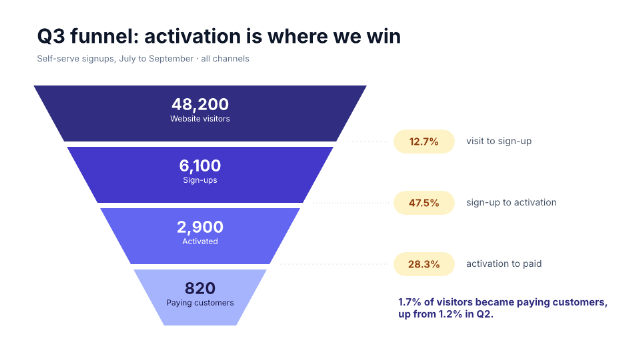
Sales Funnel Stages
A four-stage acquisition funnel drawn as tapered freeform bands, with stage counts inside and step conversion rates in pills beside each hand-off.
1 slide; 960 × 540 pt
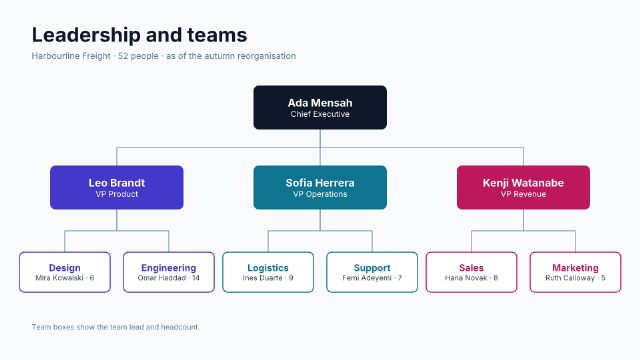
Company Org Chart
A three-level organisation chart, with a chief executive, three department heads and six teams, joined by elbow lines drawn as freeform paths.
1 slide; 960 × 540 pt
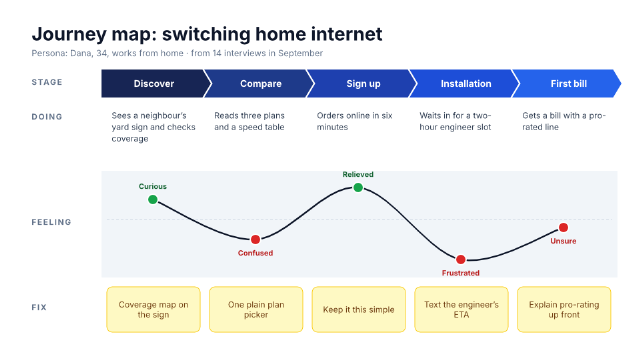
Customer Journey Map
Five stages of switching home internet, with chevron headers, what the customer does, a smoothed emotion curve and the fix for each stage.
1 slide; 960 × 540 pt