Survey Results Likert Bars
An employee survey shown as 100% stacked bars, five answers per statement in a red-to-blue diverging palette taken from the theme.
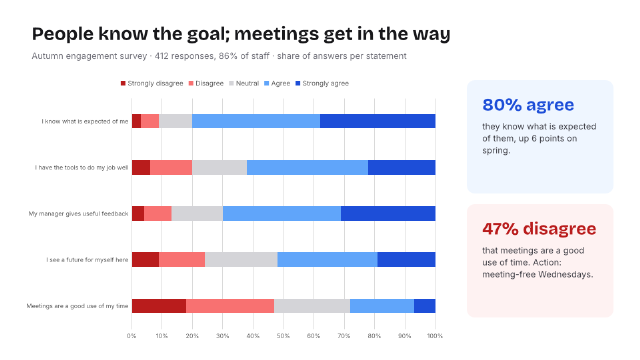
A percent-stacked bar chart is the honest way to show agree/disagree answers: every bar is 100% and the eye compares where the blue begins. The five theme accents are set to a diverging palette so the series take their colours from the deck, and two cards name the strongest and weakest statement.
Steps
38 commandssteps:
- { command: design.colors, params: { colors: { accent1: "#b91c1c", accent2: "#f87171", accent3: "#d4d4d8", accent4: "#60a5fa", accent5: "#1d4ed8" } } }
- { command: design.fonts, params: { major: Bricolage Grotesque, minor: Inter } }
- { command: slide.layout, params: { layout: blank, index: 0 } }
- { command: insert.textBox, params: { rect: [40, 30, 880, 46], text: People know the goal; meetings get in the way }, as: title }
- { command: format.font, params: { ids: [$title.id], family: Bricolage Grotesque } }
- { command: format.size, params: { ids: [$title.id], size: 28 } }
- { command: format.bold, params: { ids: [$title.id] } }
- { command: format.color, params: { ids: [$title.id], color: "#18181b" } }
- { command: insert.textBox, params: { rect: [40, 72, 880, 24], text: "Autumn engagement survey · 412 responses, 86% of staff · share of answers per statement" }, as: lede }
- { command: format.size, params: { ids: [$lede.id], size: 13 } }
- { command: format.color, params: { ids: [$lede.id], color: "#71717a" } }
- command: insert.chart
params:
type: percentBar
rect: [32, 108, 640, 410]
categories:
- Meetings are a good use of my time
- I see a future for myself here
- My manager gives useful feedback
- I have the tools to do my job well
- I know what is expected of me
series:
- { name: Strongly disagree, values: [18, 9, 4, 6, 3] }
- { name: Disagree, values: [29, 15, 9, 14, 6] }
- { name: Neutral, values: [25, 24, 17, 18, 11] }
- { name: Agree, values: [21, 33, 39, 40, 42] }
- { name: Strongly agree, values: [7, 19, 31, 22, 38] }
as: chart
- { command: chart.options, params: { id: $chart.id, title: null, legend: t, dataLabels: false, gridlines: true } }
- { command: shape.insert, params: { preset: roundRect, rect: [700, 120, 220, 170], adj: [7000] }, as: good }
- { command: shape.insert, params: { preset: roundRect, rect: [700, 306, 220, 170], adj: [7000] }, as: bad }
- { command: shape.fill, params: { ids: [$good.id], color: "#eff6ff" } }
- { command: shape.fill, params: { ids: [$bad.id], color: "#fef2f2" } }
- { command: shape.line, params: { ids: [$good.id, $bad.id], none: true } }
- { command: insert.textBox, params: { rect: [716, 134, 190, 146], text: "80% agree\nthey know what is expected of them, up 6 points on spring." }, as: gt }
- { command: insert.textBox, params: { rect: [716, 320, 190, 146], text: "47% disagree\nthat meetings are a good use of time. Action: meeting-free Wednesdays." }, as: bt }
- { command: format.size, params: { ids: [$gt.id, $bt.id], size: 13 } }
- { command: format.color, params: { ids: [$gt.id, $bt.id], color: "#3f3f46" } }
- { command: format.paragraph, params: { ids: [$gt.id, $bt.id], spaceAfter: 6, lineSpacing: 1.15 } }
- { command: text.edit, params: { id: $gt.id, at: [0, 0] } }
- { command: text.selectParagraph, params: { at: [0, 0] } }
- { command: format.size, params: { size: 26 } }
- { command: format.bold, params: {} }
- { command: format.font, params: { family: Bricolage Grotesque } }
- { command: format.color, params: { color: "#1d4ed8" } }
- { command: text.edit, params: { id: $bt.id, at: [0, 0] } }
- { command: text.selectParagraph, params: { at: [0, 0] } }
- { command: format.size, params: { size: 26 } }
- { command: format.bold, params: {} }
- { command: format.font, params: { family: Bricolage Grotesque } }
- { command: format.color, params: { color: "#b91c1c" } }
- { command: text.exit, params: {} }
- { command: shape.inspect, params: { id: $chart.id }, as: c }
- { command: slide.inspect, params: { index: 0 }, as: slide }Checks
6 checks on every buildinspect.slides= {"count":1}results.c.shape.kind= {"kind":"percentBar","series":{"count":5},"categories":{"count":5}}results.c.shape.kind.series.4= {"name":"Strongly agree","values":[7,19,31,22,38]}results.slide.design= {"none":{"code":"design.low-contrast"}}- Diagnostics: none, the kit's own check finds nothing wrong
- The saved document opens again, and its thumbnail matches
thumb.pngwithin the render tolerance
Related
More Slide samples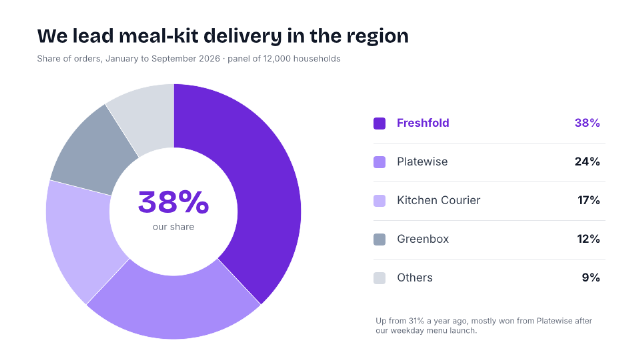
Market Share Doughnut
A doughnut chart of market share with the company's own slice in a strong colour, its share set large in the hole, and a hand-built legend with values.
Revenue Mix Stacked Columns
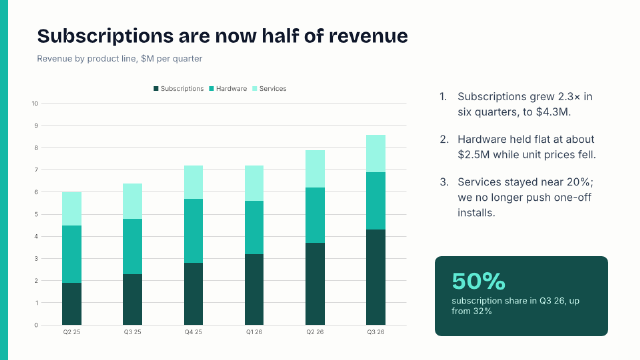
Six quarters of revenue stacked by product line in one colour family, with a headline that states the shift and three numbered takeaways.
KPI Dashboard with Sparklines
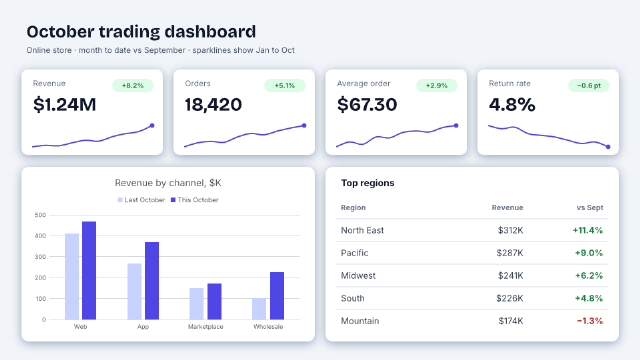
A monthly e-commerce dashboard with four KPI tiles carrying freeform sparklines and change pills, a channel column chart and a regional table.
Budget vs Actual Table
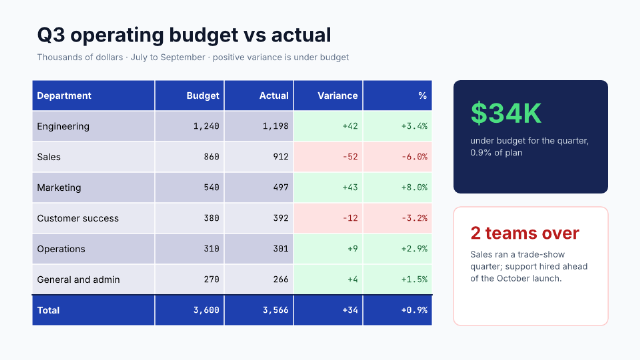
A quarterly operating budget table with right-aligned monospaced figures, green and red variance cells, a bold total row and two callout cards.