KPI Dashboard with Sparklines
A monthly e-commerce dashboard with four KPI tiles carrying freeform sparklines and change pills, a channel column chart and a regional table.
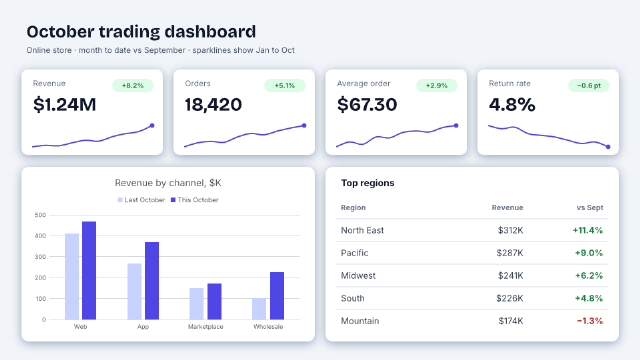
Everything a weekly business review needs on one slide. Each tile's sparkline is a smooth freeform path through ten months of values with a dot on the latest; green pills show the change. Below, a clustered column chart compares channels with last year and a light table ranks regions.
Steps
85 commandssteps:
- { command: design.colors, params: { colors: { accent1: "#c7d2fe", accent2: "#4f46e5" } } }
- { command: design.fonts, params: { major: Bricolage Grotesque, minor: Inter } }
- { command: slide.layout, params: { layout: blank, index: 0 } }
- { command: design.background, params: { color: "#f1f5f9" } }
- { command: insert.textBox, params: { rect: [32, 28, 600, 40], text: October trading dashboard }, as: title }
- { command: format.font, params: { ids: [$title.id], family: Bricolage Grotesque } }
- { command: format.size, params: { ids: [$title.id], size: 26 } }
- { command: format.bold, params: { ids: [$title.id] } }
- { command: format.color, params: { ids: [$title.id], color: "#0f172a" } }
- { command: insert.textBox, params: { rect: [32, 64, 600, 24], text: "Online store · month to date vs September · sparklines show Jan to Oct" }, as: lede }
- { command: format.size, params: { ids: [$lede.id], size: 12 } }
- { command: format.color, params: { ids: [$lede.id], color: "#475569" } }
- { command: shape.insert, params: { preset: roundRect, rect: [32, 104, 212, 128], adj: [7000] }, as: tile0 }
- { command: insert.textBox, params: { rect: [42, 114, 140, 22], text: Revenue }, as: lab0 }
- { command: insert.textBox, params: { rect: [42, 136, 190, 44], text: "$$1.24M" }, as: val0 }
- { command: shape.insert, params: { preset: roundRect, rect: [168, 118, 62, 20], text: "+8.2%", adj: [50000] }, as: dp0 }
- { command: shape.freeform, params: { points: [[48.0, 220.0], [68.0, 217.7], [88.0, 218.5], [108.0, 213.9], [128.0, 210.1], [148.0, 211.6], [168.0, 204.8], [188.0, 200.2], [208.0, 197.1], [228.0, 188.0]], smooth: true }, as: sp0 }
- { command: shape.insert, params: { preset: ellipse, rect: [224.5, 184.5, 7, 7] }, as: dot0 }
- { command: shape.insert, params: { preset: roundRect, rect: [260, 104, 212, 128], adj: [7000] }, as: tile1 }
- { command: insert.textBox, params: { rect: [270, 114, 140, 22], text: Orders }, as: lab1 }
- { command: insert.textBox, params: { rect: [270, 136, 190, 44], text: "18,420" }, as: val1 }
- { command: shape.insert, params: { preset: roundRect, rect: [396, 118, 62, 20], text: "+5.1%", adj: [50000] }, as: dp1 }
- { command: shape.freeform, params: { points: [[276.0, 220.0], [296.0, 214.0], [316.0, 211.8], [336.0, 213.3], [356.0, 205.1], [376.0, 199.9], [396.0, 202.1], [416.0, 196.2], [436.0, 191.7], [456.0, 188.0]], smooth: true }, as: sp1 }
- { command: shape.insert, params: { preset: ellipse, rect: [452.5, 184.5, 7, 7] }, as: dot1 }
- { command: shape.insert, params: { preset: roundRect, rect: [488, 104, 212, 128], adj: [7000] }, as: tile2 }
- { command: insert.textBox, params: { rect: [498, 114, 140, 22], text: Average order }, as: lab2 }
- { command: insert.textBox, params: { rect: [498, 136, 190, 44], text: "$$67.30" }, as: val2 }
- { command: shape.insert, params: { preset: roundRect, rect: [624, 118, 62, 20], text: "+2.9%", adj: [50000] }, as: dp2 }
- { command: shape.freeform, params: { points: [[504.0, 220.0], [524.0, 212.6], [544.0, 216.3], [564.0, 205.1], [584.0, 206.6], [604.0, 198.4], [624.0, 196.2], [644.0, 197.7], [664.0, 191.0], [684.0, 188.0]], smooth: true }, as: sp2 }
- { command: shape.insert, params: { preset: ellipse, rect: [680.5, 184.5, 7, 7] }, as: dot2 }
- { command: shape.insert, params: { preset: roundRect, rect: [716, 104, 212, 128], adj: [7000] }, as: tile3 }
- { command: insert.textBox, params: { rect: [726, 114, 140, 22], text: Return rate }, as: lab3 }
- { command: insert.textBox, params: { rect: [726, 136, 190, 44], text: "4.8%" }, as: val3 }
- { command: shape.insert, params: { preset: roundRect, rect: [852, 118, 62, 20], text: "−0.6 pt", adj: [50000] }, as: dp3 }
- { command: shape.freeform, params: { points: [[732.0, 188.0], [752.0, 192.9], [772.0, 190.5], [792.0, 200.3], [812.0, 202.8], [832.0, 205.2], [852.0, 210.2], [872.0, 215.1], [892.0, 212.6], [912.0, 220.0]], smooth: true }, as: sp3 }
- { command: shape.insert, params: { preset: ellipse, rect: [908.5, 216.5, 7, 7] }, as: dot3 }
- { command: shape.fill, params: { ids: [$tile0.id, $tile1.id, $tile2.id, $tile3.id], color: "#ffffff" } }
- { command: shape.line, params: { ids: [$tile0.id, $tile1.id, $tile2.id, $tile3.id, $dp0.id, $dp1.id, $dp2.id, $dp3.id, $dot0.id, $dot1.id, $dot2.id, $dot3.id], none: true } }
- { command: shape.effects, params: { ids: [$tile0.id, $tile1.id, $tile2.id, $tile3.id], shadow: { color: "#94a3b8", blur: 14, dist: 3, dir: 90 } } }
- { command: format.size, params: { ids: [$lab0.id, $lab1.id, $lab2.id, $lab3.id], size: 12 } }
- { command: format.color, params: { ids: [$lab0.id, $lab1.id, $lab2.id, $lab3.id], color: "#64748b" } }
- { command: format.size, params: { ids: [$val0.id, $val1.id, $val2.id, $val3.id], size: 28 } }
- { command: format.bold, params: { ids: [$val0.id, $val1.id, $val2.id, $val3.id, $dp0.id, $dp1.id, $dp2.id, $dp3.id] } }
- { command: format.font, params: { ids: [$val0.id, $val1.id, $val2.id, $val3.id], family: Bricolage Grotesque } }
- { command: format.color, params: { ids: [$val0.id, $val1.id, $val2.id, $val3.id], color: "#0f172a" } }
- { command: shape.fill, params: { ids: [$dp0.id, $dp1.id, $dp2.id, $dp3.id], color: "#dcfce7" } }
- { command: format.size, params: { ids: [$dp0.id, $dp1.id, $dp2.id, $dp3.id], size: 10 } }
- { command: format.color, params: { ids: [$dp0.id, $dp1.id, $dp2.id, $dp3.id], color: "#15803d" } }
- { command: format.margins, params: { ids: [$dp0.id, $dp1.id, $dp2.id, $dp3.id], left: 0, right: 0, top: 0, bottom: 0 } }
- { command: shape.line, params: { ids: [$sp0.id, $sp1.id, $sp2.id, $sp3.id], color: "#4f46e5", width: 2 } }
- { command: shape.fill, params: { ids: [$dot0.id, $dot1.id, $dot2.id, $dot3.id], color: "#4f46e5" } }
- { command: shape.insert, params: { preset: roundRect, rect: [32, 250, 440, 262], adj: [4000] }, as: card1 }
- { command: shape.insert, params: { preset: roundRect, rect: [488, 250, 440, 262], adj: [4000] }, as: card2 }
- { command: shape.fill, params: { ids: [$card1.id, $card2.id], color: "#ffffff" } }
- { command: shape.line, params: { ids: [$card1.id, $card2.id], none: true } }
- { command: shape.effects, params: { ids: [$card1.id, $card2.id], shadow: { color: "#94a3b8", blur: 14, dist: 3, dir: 90 } } }
- command: insert.chart
params:
type: column
rect: [44, 258, 416, 246]
categories: [Web, App, Marketplace, Wholesale]
series:
- { name: Last October, values: [412, 268, 151, 102] }
- { name: This October, values: [468, 371, 173, 228] }
title: "Revenue by channel, $K"
as: chart
- { command: chart.options, params: { id: $chart.id, legend: t, dataLabels: false, gridlines: true } }
- { command: insert.textBox, params: { rect: [504, 262, 400, 26], text: Top regions }, as: ttitle }
- { command: format.size, params: { ids: [$ttitle.id], size: 14 } }
- { command: format.bold, params: { ids: [$ttitle.id] } }
- { command: format.color, params: { ids: [$ttitle.id], color: "#0f172a" } }
- command: insert.table
params:
rows: 6
cols: 3
rect: [504, 294, 408, 204]
data:
- [Region, Revenue, vs Sept]
- [North East, "$$312K", "+11.4%"]
- [Pacific, "$$287K", "+9.0%"]
- [Midwest, "$$241K", "+6.2%"]
- [South, "$$226K", "+4.8%"]
- [Mountain, "$$174K", "−1.3%"]
as: tb
- { command: table.style, params: { id: $tb.id, style: none } }
- { command: table.cellFormat, params: { id: $tb.id, anchor: center } }
- { command: format.size, params: { ids: [$tb.id], size: 13 } }
- { command: format.color, params: { ids: [$tb.id], color: "#334155" } }
- { command: table.border, params: { id: $tb.id, edges: insideH, color: "#e2e8f0", width: 1, from: [0, 0], to: [5, 2] } }
- { command: table.selectCells, params: { id: $tb.id, from: [0, 0], to: [0, 2] } }
- { command: format.size, params: { size: 11 } }
- { command: format.bold, params: {} }
- { command: format.color, params: { color: "#64748b" } }
- { command: table.selectCells, params: { id: $tb.id, from: [0, 1], to: [5, 2] } }
- { command: format.align, params: { align: right } }
- { command: table.selectCells, params: { id: $tb.id, from: [1, 2], to: [4, 2] } }
- { command: format.color, params: { color: "#15803d" } }
- { command: format.bold, params: {} }
- { command: table.selectCells, params: { id: $tb.id, from: [5, 2], to: [5, 2] } }
- { command: format.color, params: { color: "#b91c1c" } }
- { command: format.bold, params: {} }
- { command: table.columnWidth, params: { id: $tb.id, col: 0, width: 168 } }
- { command: table.columnWidth, params: { id: $tb.id, col: 1, width: 120 } }
- { command: table.columnWidth, params: { id: $tb.id, col: 2, width: 120 } }
- { command: shape.inspect, params: { id: $sp0.id }, as: spark }
- { command: slide.inspect, params: { index: 0 }, as: slide }Checks
6 checks on every buildinspect.slides= {"count":1}results.spark.shape.geom.kind= "custom"results.slide.shapes= {"all":{"kind":{"oneOf":["shape","textBox","chart","table"]}},"any":{"kind":"table","table":{"rows":6,"cols":3}}}results.slide.design= {"none":{"code":"design.low-contrast"}}- Diagnostics: none, the kit's own check finds nothing wrong
- The saved document opens again, and its thumbnail matches
thumb.pngwithin the render tolerance
Related
More Slide samples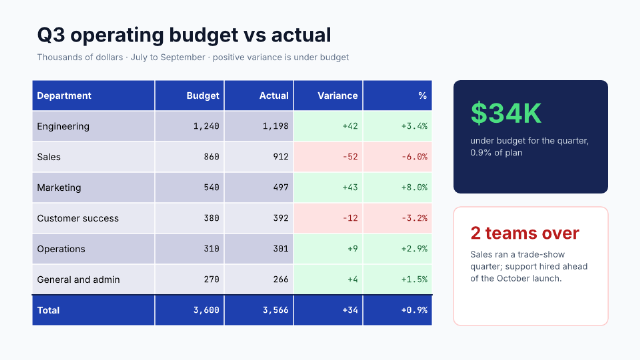
Budget vs Actual Table
A quarterly operating budget table with right-aligned monospaced figures, green and red variance cells, a bold total row and two callout cards.
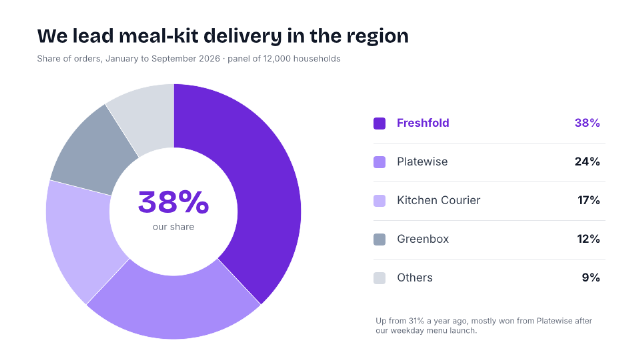
Market Share Doughnut
A doughnut chart of market share with the company's own slice in a strong colour, its share set large in the hole, and a hand-built legend with values.
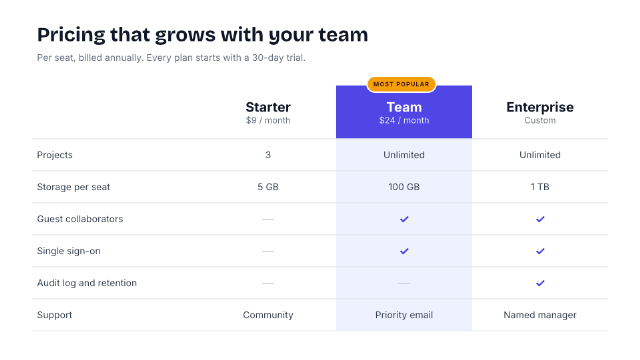
Pricing Plan Comparison
A three-tier pricing table with a highlighted recommended column, a "Most popular" badge, check marks and right-sized rows.
Revenue Mix Stacked Columns
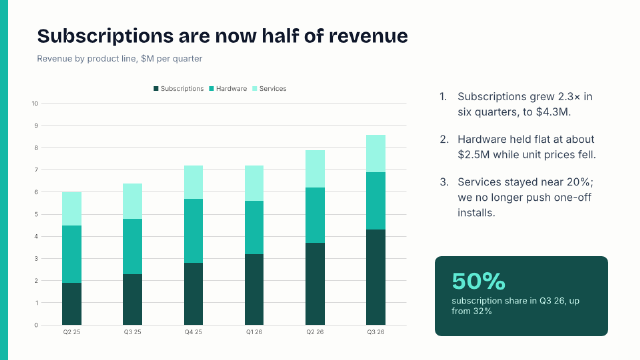
Six quarters of revenue stacked by product line in one colour family, with a headline that states the shift and three numbered takeaways.