Prepare the brief
Prepare verified facts, labels, units, relationships, and an intended reading order before generating an explanatory visual.
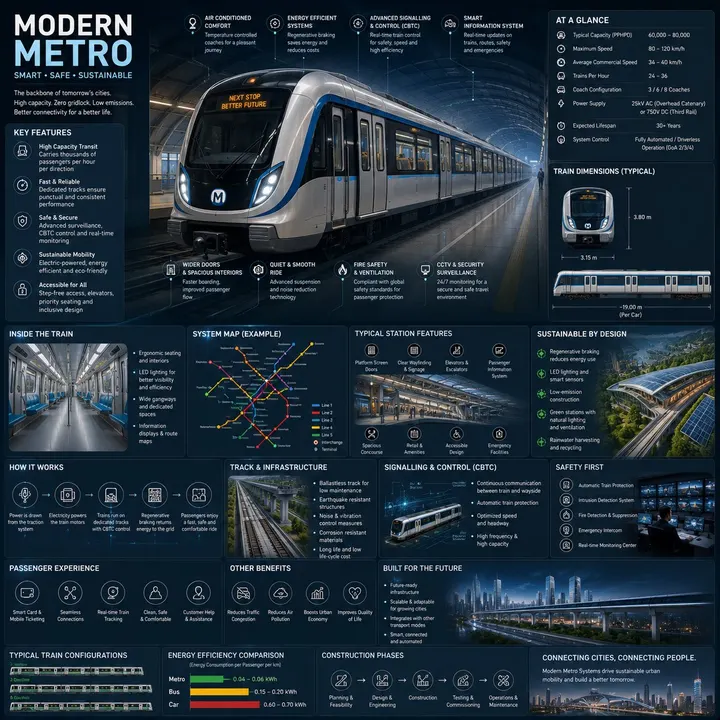
Modern metro engineering infographic. Create your own image using this visual style and composition.
Template inputs
- Main subject (required)
- What should this image be about?
Suggested settings
| Operation | generate |
|---|---|
| Aspect ratio | 1:1 |
| Quality | high |
| Resolution | 2K |
| Text | Generated text is part of the image; proofread it. |
| Available surfaces | document, table, whiteboard |
Use this template in Kition
- Open the image template picker from a supported document, table, or Whiteboard image surface.
- Search for “Modern metro engineering infographic” and compare the preview with this example. The catalog ID is
gpt-image-2-case-447, version 1.0.0. - Fill in the main subject and any optional fields shown above.
- Choose an image-capable service, check the available dimensions and usage cost, then generate one candidate.
- Review the result, save the useful image into the workspace, and retain the brief with the output.
Review the output
Compare every number and label against your source table. Generated charts are illustrations and must not be treated as computed data visualizations.
Use a table record to track the brief, candidate image, owner, and review status. Insert the selected asset into a document for context, or use Design Studio when the headline needs to remain editable.
Source and limitations
Preview examples and adapted templates originate from the credited MIT-licensed library. They illustrate a visual direction and do not promise identical output. Kition requires a configured image service; model requests may consume provider usage or Cloud credits.
Read the full source licenseA generated image is a raster asset. Rendering a table, document, or interface inside the image does not create a working table, document, or app.