Community Solar Infographic
A half-year report infographic with live column and pie graphs restyled in the brand palette, stat cards and a sun icon.
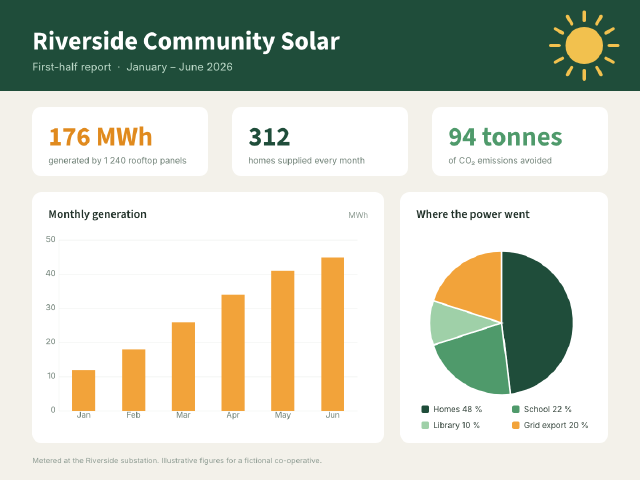
Both charts are live graph objects (`graph.create`): a column graph of monthly output and a pie of where the power went. Their series groups are recoloured through `document.node`, the axis lines given a light grey and the axis labels set in Inter; the pie's legend is turned off and redrawn as chips with percentages. The header sun's rays are one line rotated with copies.
Steps
81 commandssteps:
- { command: layer.setProps, params: { name: Charts } }
- { command: graph.create, params: { type: column, x: 110, y: 450, width: 560, height: 320, series: [MWh], categories: [Jan, Feb, Mar, Apr, May, Jun], rows: [[12], [18], [26], [34], [41], [45]] }, as: columns }
- { command: graph.setType, params: { id: $columns.id, legend: false, columnWidth: 58, tickLength: full, ticks: 5, axisMin: 0, axisMax: 50 } }
- { command: document.node, params: { id: $columns.id, summary: true, depth: 1 }, as: columnParts }
- { command: paint.setFill, params: { ids: [$columnParts.children.0.id], color: "#f2a33a" } }
- { command: paint.setStroke, params: { ids: [$columnParts.children.1.id], color: "#dfe5df" } }
- { command: graph.create, params: { type: pie, x: 790, y: 455, width: 300, height: 300, series: [Homes, School, Library, Grid export], categories: [""], rows: [[48, 22, 10, 20]] }, as: pie }
- { command: graph.setType, params: { id: $pie.id, legend: false } }
- { command: document.node, params: { id: $pie.id, summary: true, depth: 1 }, as: pieParts }
- { command: select.object.textObjects, params: {} }
- { command: text.setStyle, params: { font: Inter, size: 15, fill: "#6b7d72" } }
- { command: paint.setStroke, params: { none: true } }
- { command: select.none, params: {} }
- { command: paint.setFill, params: { ids: [$pieParts.children.3.id], color: "#1f4d3a" } }
- { command: paint.setFill, params: { ids: [$pieParts.children.2.id], color: "#4f9a6b" } }
- { command: paint.setFill, params: { ids: [$pieParts.children.1.id], color: "#9fd0a8" } }
- { command: paint.setFill, params: { ids: [$pieParts.children.0.id], color: "#f2a33a" } }
- { command: paint.setStroke, params: { ids: [$pie.id], color: "#ffffff" } }
- { command: stroke.set, params: { ids: [$pie.id], weight: 3 } }
- { command: layer.new, params: { name: Layout }, as: layout }
- { command: layer.move, params: { ids: [$layout.id], target: 1, place: below } }
- { command: layer.setCurrent, params: { id: $layout.id } }
- { command: select.none, params: {} }
- { command: shape.rectangle, params: { x: 0, y: 0, width: 1200, height: 900 } }
- { command: paint.setStroke, params: { none: true } }
- { command: paint.setFill, params: { color: "#f3f1ea" } }
- { command: shape.rectangle, params: { x: 0, y: 0, width: 1200, height: 170 } }
- { command: paint.setFill, params: { color: "#1f4d3a" } }
- { command: shape.rectangle, params: { x: 60, y: 200, width: 330, height: 130, radius: 16 } }
- { command: paint.setFill, params: { color: "#ffffff" } }
- { command: shape.rectangle, params: { x: 435, y: 200, width: 330, height: 130, radius: 16 } }
- { command: shape.rectangle, params: { x: 810, y: 200, width: 330, height: 130, radius: 16 } }
- { command: shape.rectangle, params: { x: 60, y: 360, width: 660, height: 470, radius: 16 } }
- { command: shape.rectangle, params: { x: 750, y: 360, width: 390, height: 470, radius: 16 } }
- { command: shape.ellipse, params: { x: 1060, y: 50, width: 70, height: 70 }, as: sun }
- { command: paint.setFill, params: { color: "#f2c14e" } }
- { command: shape.line, params: { x1: 1095, y1: 38, x2: 1095, y2: 22 }, as: ray }
- { command: paint.setStroke, params: { color: "#f2c14e" } }
- { command: stroke.set, params: { weight: 6, cap: round } }
- { command: object.rotate, params: { angle: 30, origin: [1095, 85], copy: true } }
- { command: object.transformAgain, params: {} }
- { command: object.transformAgain, params: {} }
- { command: object.transformAgain, params: {} }
- { command: object.transformAgain, params: {} }
- { command: object.transformAgain, params: {} }
- { command: object.transformAgain, params: {} }
- { command: object.transformAgain, params: {} }
- { command: object.transformAgain, params: {} }
- { command: object.transformAgain, params: {} }
- { command: object.transformAgain, params: {} }
- { command: select.none, params: {} }
- { command: paint.setStroke, params: { none: true } }
- { command: shape.rectangle, params: { x: 790, y: 760, width: 14, height: 14, radius: 3 } }
- { command: paint.setFill, params: { color: "#1f4d3a" } }
- { command: shape.rectangle, params: { x: 960, y: 760, width: 14, height: 14, radius: 3 } }
- { command: paint.setFill, params: { color: "#4f9a6b" } }
- { command: shape.rectangle, params: { x: 790, y: 790, width: 14, height: 14, radius: 3 } }
- { command: paint.setFill, params: { color: "#9fd0a8" } }
- { command: shape.rectangle, params: { x: 960, y: 790, width: 14, height: 14, radius: 3 } }
- { command: paint.setFill, params: { color: "#f2a33a" } }
- { command: layer.new, params: { name: Text, top: true }, as: words }
- { command: select.none, params: {} }
- { command: text.create, params: { x: 60, y: 92, text: Riverside Community Solar, size: 48, font: Source Sans 3, style: Bold, color: "#ffffff" } }
- { command: text.create, params: { x: 60, y: 132, text: "First-half report · January – June 2026", size: 20, font: Inter, color: "#bfdccb" } }
- { command: text.create, params: { x: 90, y: 272, text: 176 MWh, size: 50, font: Source Sans 3, style: Bold, color: "#e08a1e" } }
- { command: text.create, params: { x: 90, y: 306, text: generated by 1 240 rooftop panels, size: 16, font: Inter, color: "#6b7d72" } }
- { command: text.create, params: { x: 465, y: 272, text: "312", size: 50, font: Source Sans 3, style: Bold, color: "#1f4d3a" } }
- { command: text.create, params: { x: 465, y: 306, text: homes supplied every month, size: 16, font: Inter, color: "#6b7d72" } }
- { command: text.create, params: { x: 840, y: 272, text: 94 tonnes, size: 50, font: Source Sans 3, style: Bold, color: "#4f9a6b" } }
- { command: text.create, params: { x: 840, y: 306, text: of CO₂ emissions avoided, size: 16, font: Inter, color: "#6b7d72" } }
- { command: text.create, params: { x: 90, y: 408, text: Monthly generation, size: 22, font: Source Sans 3, style: Semibold, color: "#1f2f27" } }
- { command: text.create, params: { x: 690, y: 408, text: MWh, size: 15, font: Inter, color: "#8d9b92" }, as: unit }
- { command: text.setStyle, params: { id: $unit.id, justify: right } }
- { command: text.create, params: { x: 780, y: 408, text: Where the power went, size: 22, font: Source Sans 3, style: Semibold, color: "#1f2f27" } }
- { command: text.create, params: { x: 812, y: 772, text: Homes 48 %, size: 15, font: Inter, color: "#33433a" } }
- { command: text.create, params: { x: 982, y: 772, text: School 22 %, size: 15, font: Inter, color: "#33433a" } }
- { command: text.create, params: { x: 812, y: 802, text: Library 10 %, size: 15, font: Inter, color: "#33433a" } }
- { command: text.create, params: { x: 982, y: 802, text: Grid export 20 %, size: 15, font: Inter, color: "#33433a" } }
- { command: text.create, params: { x: 60, y: 868, text: "Metered at the Riverside substation. Illustrative figures for a fictional co-operative.", size: 14, font: Inter, color: "#8d9b92" } }
- { command: select.none, params: {} }
- { command: text.fonts, params: {}, as: fonts }Checks
13 checks on every buildinspect.layers= {"count":3}inspect.layers.0= {"name":"Text","children":{"count":16,"all":{"kind":"Type"}}}inspect.layers.1= {"name":"Charts","children":{"count":2,"all":{"kind":"Group"}}}inspect.layers.1.children.0= {"name":"Pie Graph","children":{"count":4}}inspect.layers.1.children.0.children.3= {"name":"Homes","children":{"all":{"fill":"#1f4d3a"}}}inspect.layers.1.children.1= {"name":"Column Graph"}inspect.layers.1.children.1.children.0= {"name":"MWh","children":{"count":6,"all":{"fill":"#f2a33a"}}}inspect.layers.2= {"name":"Layout"}results.columnParts.children= {"count":2}results.pieParts.children= {"count":4}results.fonts= {"all":{"status":"exact","missingGlyphs":0,"noGlyph":0}}- Diagnostics: none, the kit's own check finds nothing wrong
- The saved document opens again, and its thumbnail matches
thumb.pngwithin the render tolerance
Related
More Vector samples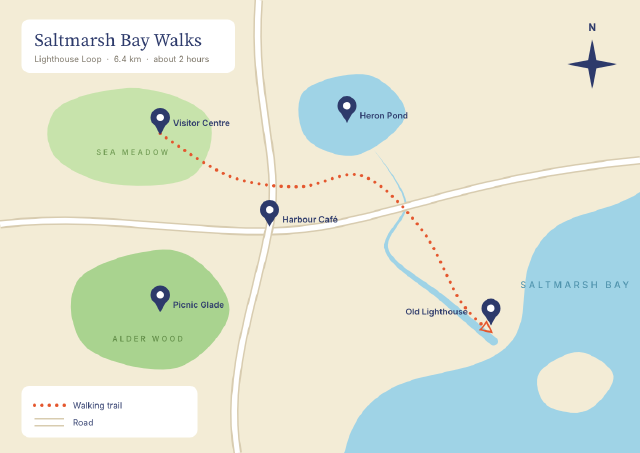
Saltmarsh Bay Trail Map
An illustrated walking map — curvature-tool coastline and parks, roads with two-stroke appearances, a dashed trail and pins placed from one symbol.
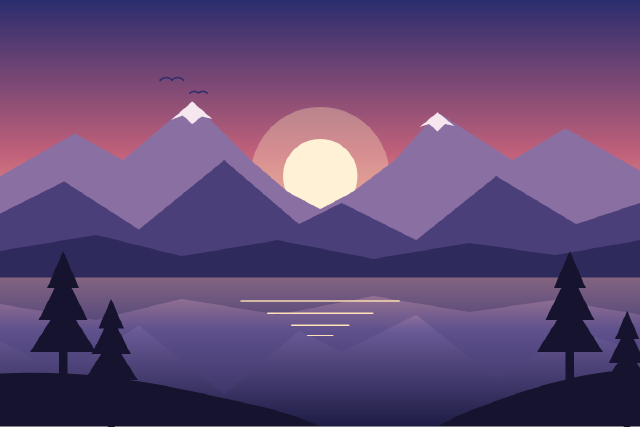
Alpine Lake Sunrise
A flat landscape illustration — layered mountains, a low sun and pines mirrored in a still lake — built on named layers.
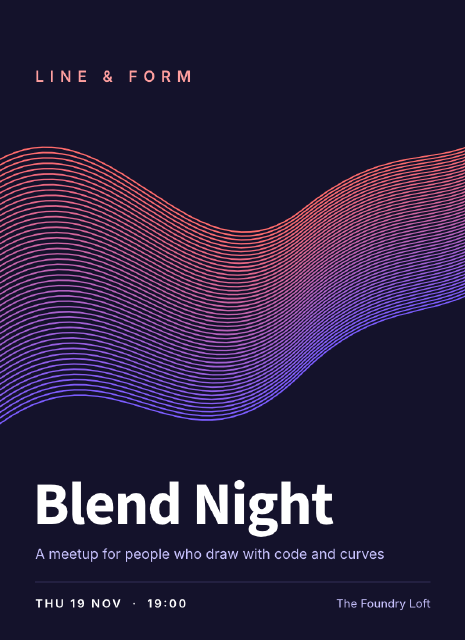
Blend Ribbon Meetup Poster
A design-meetup poster whose flowing ribbon is a 48-step blend between two stroked curves, from coral to violet.
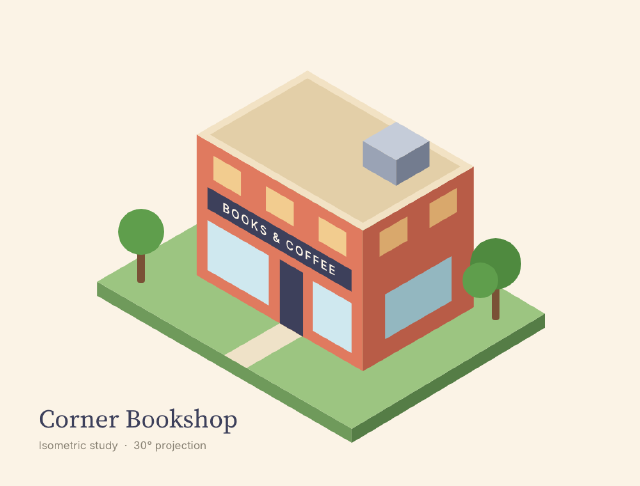
Isometric Corner Bookshop
A small isometric building whose facades are drawn flat and projected onto the 30° grid with affine transforms.