Statistics Lecture in 4:3
A classic 4:3 lecture slide in the built-in Paper theme, a dot plot of ten incomes showing how one outlier pulls the mean away from the median.
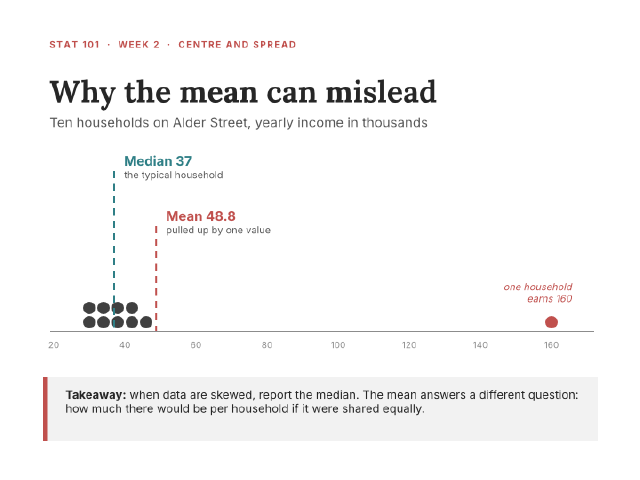
`design.slideSize` switches the deck to the standard 4:3 size (720 × 540 pt) for an older lecture hall projector. The Paper theme gives the greys and the brick-red accent; Lora and Inter replace its fonts. The dot plot is drawn from ellipses and dashed lines on a hand-made axis, and the title placeholders are moved and restyled rather than deleted.
Steps
88 commandssteps:
- { command: design.theme, params: { name: "Paper" } }
- { command: design.fonts, params: { major: "Lora", minor: "Inter" } }
- { command: design.slideSize, params: { preset: "standard", scale: "ensureFit" }, as: size }
- { command: slide.inspect, params: { index: 0 }, as: s0 }
- { command: text.set, params: { id: $s0.shapes.0.id, text: "Why the mean can mislead" } }
- { command: text.set, params: { id: $s0.shapes.1.id, text: "Ten households on Alder Street, yearly income in thousands" } }
- { command: shape.setBounds, params: { ids: ["$s0.shapes.0.id"], x: 48, y: 70, w: 624, h: 56 } }
- { command: shape.setBounds, params: { ids: ["$s0.shapes.1.id"], x: 48, y: 126, w: 624, h: 28 } }
- { command: format.align, params: { ids: ["$s0.shapes.0.id", "$s0.shapes.1.id"], align: "left" } }
- { command: format.size, params: { ids: ["$s0.shapes.0.id"], size: 34 } }
- { command: format.bold, params: { ids: ["$s0.shapes.0.id"], on: true } }
- { command: format.color, params: { ids: ["$s0.shapes.0.id"], color: "#262626" } }
- { command: format.size, params: { ids: ["$s0.shapes.1.id"], size: 15 } }
- { command: format.color, params: { ids: ["$s0.shapes.1.id"], color: "#595959" } }
- { command: format.anchor, params: { ids: ["$s0.shapes.0.id"], anchor: "bottom" } }
- { command: format.anchor, params: { ids: ["$s0.shapes.1.id"], anchor: "top" } }
- { command: insert.textBox, params: { rect: [48, 40, 400, 22], text: "STAT 101 · WEEK 2 · CENTRE AND SPREAD" }, as: k }
- { command: format.size, params: { ids: ["$k.id"], size: 10 } }
- { command: format.bold, params: { ids: ["$k.id"] } }
- { command: format.spacing, params: { ids: ["$k.id"], pt: 1.5 } }
- { command: format.color, params: { ids: ["$k.id"], color: "#C0504D" } }
- { command: shape.insert, params: { preset: "line", rect: [56, 372, 612, 0] }, as: axis }
- { command: shape.line, params: { ids: ["$axis.id"], color: "#8c8c8c", width: 1 } }
- { command: insert.textBox, params: { rect: [40, 378, 40, 18], text: "20" }, as: tk20 }
- { command: insert.textBox, params: { rect: [120, 378, 40, 18], text: "40" }, as: tk40 }
- { command: insert.textBox, params: { rect: [200, 378, 40, 18], text: "60" }, as: tk60 }
- { command: insert.textBox, params: { rect: [280, 378, 40, 18], text: "80" }, as: tk80 }
- { command: insert.textBox, params: { rect: [360, 378, 40, 18], text: "100" }, as: tk100 }
- { command: insert.textBox, params: { rect: [440, 378, 40, 18], text: "120" }, as: tk120 }
- { command: insert.textBox, params: { rect: [520, 378, 40, 18], text: "140" }, as: tk140 }
- { command: insert.textBox, params: { rect: [600, 378, 40, 18], text: "160" }, as: tk160 }
- { command: format.size, params: { ids: ["$tk20.id", "$tk40.id", "$tk60.id", "$tk80.id", "$tk100.id", "$tk120.id", "$tk140.id", "$tk160.id"], size: 10 } }
- { command: format.align, params: { ids: ["$tk20.id", "$tk40.id", "$tk60.id", "$tk80.id", "$tk100.id", "$tk120.id", "$tk140.id", "$tk160.id"], align: "center" } }
- { command: format.color, params: { ids: ["$tk20.id", "$tk40.id", "$tk60.id", "$tk80.id", "$tk100.id", "$tk120.id", "$tk140.id", "$tk160.id"], color: "#8c8c8c" } }
- { command: shape.insert, params: { preset: "ellipse", rect: [93, 355, 14, 14] }, as: d30_0 }
- { command: shape.insert, params: { preset: "ellipse", rect: [93, 339, 14, 14] }, as: d30_1 }
- { command: shape.insert, params: { preset: "ellipse", rect: [109, 355, 14, 14] }, as: d34_0 }
- { command: shape.insert, params: { preset: "ellipse", rect: [109, 339, 14, 14] }, as: d34_1 }
- { command: shape.insert, params: { preset: "ellipse", rect: [125, 355, 14, 14] }, as: d38_0 }
- { command: shape.insert, params: { preset: "ellipse", rect: [125, 339, 14, 14] }, as: d38_1 }
- { command: shape.insert, params: { preset: "ellipse", rect: [141, 355, 14, 14] }, as: d42_0 }
- { command: shape.insert, params: { preset: "ellipse", rect: [141, 339, 14, 14] }, as: d42_1 }
- { command: shape.insert, params: { preset: "ellipse", rect: [157, 355, 14, 14] }, as: d46_0 }
- { command: shape.insert, params: { preset: "ellipse", rect: [613, 355, 14, 14] }, as: d160_0 }
- { command: shape.fill, params: { ids: ["$d30_0.id", "$d30_1.id", "$d34_0.id", "$d34_1.id", "$d38_0.id", "$d38_1.id", "$d42_0.id", "$d42_1.id", "$d46_0.id", "$d160_0.id"], color: "#404040" } }
- { command: shape.line, params: { ids: ["$d30_0.id", "$d30_1.id", "$d34_0.id", "$d34_1.id", "$d38_0.id", "$d38_1.id", "$d42_0.id", "$d42_1.id", "$d46_0.id", "$d160_0.id"], none: true } }
- { command: shape.fill, params: { ids: ["$d160_0.id"], color: "#C0504D" } }
- { command: shape.insert, params: { preset: "line", rect: [128, 192, 0, 180] }, as: med }
- { command: shape.line, params: { ids: ["$med.id"], color: "#2f7f86", width: 2, dash: "dash" } }
- { command: shape.insert, params: { preset: "line", rect: [175.2, 254, 0, 118] }, as: mean }
- { command: shape.line, params: { ids: ["$mean.id"], color: "#C0504D", width: 2, dash: "dash" } }
- { command: insert.textBox, params: { rect: [132, 168, 170, 40], text: "Median 37\nthe typical household" }, as: medL }
- { command: insert.textBox, params: { rect: [179.2, 230, 170, 40], text: "Mean 48.8\npulled up by one value" }, as: meanL }
- { command: format.size, params: { ids: ["$medL.id", "$meanL.id"], size: 11 } }
- { command: format.color, params: { ids: ["$medL.id", "$meanL.id"], color: "#595959" } }
- { command: text.edit, params: { id: $medL.id, at: [0, 0] } }
- { command: text.selectParagraph, params: { at: [0, 0] } }
- { command: format.size, params: { size: 15 } }
- { command: format.bold, params: { on: true } }
- { command: format.color, params: { color: "#2f7f86" } }
- { command: text.exit, params: { } }
- { command: text.edit, params: { id: $meanL.id, at: [0, 0] } }
- { command: text.selectParagraph, params: { at: [0, 0] } }
- { command: format.size, params: { size: 15 } }
- { command: format.bold, params: { on: true } }
- { command: format.color, params: { color: "#C0504D" } }
- { command: text.exit, params: { } }
- { command: insert.textBox, params: { rect: [520, 312, 130, 36], text: "one household\nearns 160" }, as: outL }
- { command: format.size, params: { ids: ["$outL.id"], size: 11 } }
- { command: format.align, params: { ids: ["$outL.id"], align: "right" } }
- { command: format.color, params: { ids: ["$outL.id"], color: "#C0504D" } }
- { command: format.italic, params: { ids: ["$outL.id"] } }
- { command: shape.insert, params: { preset: "rect", rect: [48, 424, 624, 72] }, as: box }
- { command: shape.fill, params: { ids: ["$box.id"], color: "#F2F2F2" } }
- { command: shape.line, params: { ids: ["$box.id"], none: true } }
- { command: shape.insert, params: { preset: "rect", rect: [48, 424, 5, 72] }, as: bar }
- { command: shape.fill, params: { ids: ["$bar.id"], color: "#C0504D" } }
- { command: shape.line, params: { ids: ["$bar.id"], none: true } }
- { command: insert.textBox, params: { rect: [66, 432, 596, 56], text: "Takeaway: when data are skewed, report the median. The mean answers a different question: how much there would be per household if it were shared equally." }, as: tk }
- { command: format.size, params: { ids: ["$tk.id"], size: 13 } }
- { command: format.color, params: { ids: ["$tk.id"], color: "#262626" } }
- { command: format.anchor, params: { ids: ["$tk.id"], anchor: "middle" } }
- { command: text.edit, params: { id: $tk.id, at: [0, 0] } }
- { command: text.select, params: { anchor: [0, 0], caret: [0, 9] } }
- { command: format.bold, params: { on: true } }
- { command: text.exit, params: { } }
- { command: slide.notes, params: { index: 0, text: "Ask: if a new neighbour earning 400 moved in, which marker moves more? Then show the boxplot on the next slide." } }
- { command: document.inspect, params: { }, as: deck }Checks
8 checks on every buildinspect.slides= {"count":1}inspect.slideSize= {"width":720,"height":540}results.size= {"w":720,"h":540}results.deck.theme= "Paper"results.deck.slides.0.layout= "Title Slide"results.deck.slides.0.title= "Why the mean can mislead"- Diagnostics: none, the kit's own check finds nothing wrong
- The saved document opens again, and its thumbnail matches
thumb.pngwithin the render tolerance
Related
More Slide samples
All-Hands with Sections
A team all-hands deck in the built-in Slate theme, organised in three sections with bold Section Header dividers, Two Content and Comparison slides.
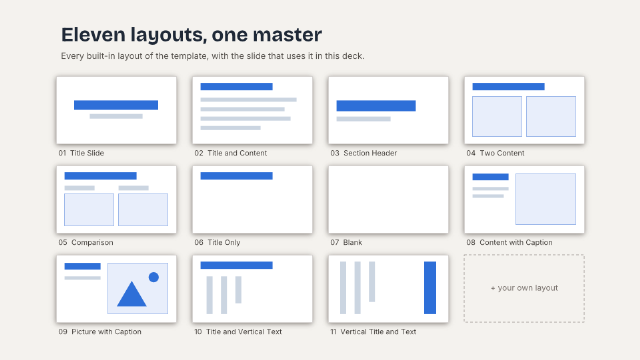
Layout Gallery
A template guide whose first slide maps all eleven built-in layouts as wireframes, followed by one real slide in each layout.
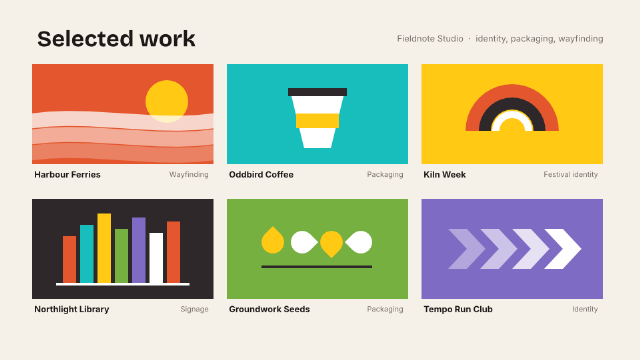
Studio Portfolio Grid
A design studio's selected-work grid in a custom theme colour scheme, six project tiles drawn from shapes in the six accent colours.
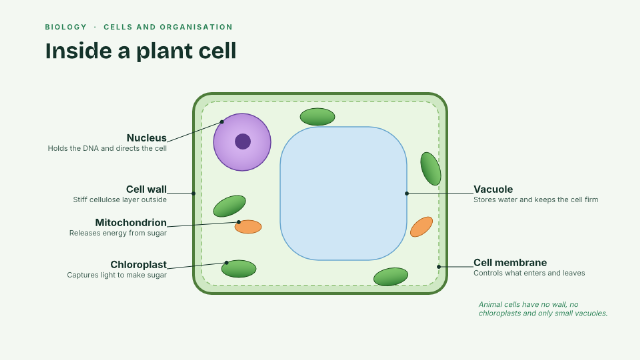
Plant Cell Diagram
A labelled biology diagram of a plant cell drawn from shapes, with six callouts joined to the organelles by connectors.